| Issue |
A&A
Volume 704, December 2025
|
|
|---|---|---|
| Article Number | C1 | |
| Number of page(s) | 2 | |
| Section | Extragalactic astronomy | |
| DOI | https://doi.org/10.1051/0004-6361/202557798e | |
| Published online | 08 December 2025 | |
Bar ages derived for the first time in nearby galaxies
Insights into secular evolution from the TIMER sample (Corrigendum)
1
European Southern Observatory, Alonso de Córdova 3107, Vitacura, Región Metropolitana, Chile
2
Centre for Extragalactic Astronomy, Department of Physics, Durham University, South Road, Durham DH1 3LE, UK
3
Institute for Computational Cosmology, Department of Physics, Durham University, South Road, Durham DH1 3LE, UK
4
Universidade de São Paulo, Instituto de Astronomia, Geofísica e Ciências Atmosféricas, Rua do Matão 1226, 05508-090 São Paulo, SP, Brazil
5
Universidad de La Laguna, Departamento de Astrofísica. Avda. Astrofísico Francisco Sánchez S/N, E 38206 La Laguna, Tenerife, Spain
6
Instituto de Astrofísica de Canarias. C/ Vía Láctea, S/N, E-38205 La Laguna, Tenerife, Spain
7
Instituto de Física de Partículas y del Cosmos (IPARCOS), Universidad Complutense de Madrid, 28040 Madrid, Spain
8
Department of Astronomy and Atmospheric Sciences, Kyungpook National University, Daegu 41566, Republic of Korea
9
Max Planck Institute for Astronomy, Königstuhl 17, 69117 Heidelberg, Germany
10
Observatorio Astronómico Nacional (IGN), C/ Alfonso XII 3, E-28014 Madrid, Spain
11
Department of Astrophysics, University of Vienna, Türkenschanzstraße 17, 1180 Wien, Austria
★ Corresponding author: This email address is being protected from spambots. You need JavaScript enabled to view it.
Key words: errata, addenda / galaxies: bulges / galaxies: evolution / galaxies: kinematics and dynamics / galaxies: star formation / galaxies: stellar content / galaxies: structure
This is an erratum regarding the miscalculated values of the nuclear discs’ stellar masses published in de Sá-Freitas et al. (2023, 2025), which were calculated by integrating the ‘isolated’ star formation histories of the nuclear discs. However, after publication, we noticed an erroneous conversion of units in one step, which is reflected in values that are systematically around three times smaller than the updated ones. We present here the updated values of the nuclear discs’ stellar masses in Table 1 (original Table 3), and the updated result of the nuclear disc stellar masses as a function of bar age (Figure 1, original Figure 9). We would like to highlight that the results from de Sá-Freitas et al. (2025) are qualitatively unchanged (r ∼ 0.7 and p-value ∼ 0.007), and hence the discussion and conclusions remain unaltered. Finally, we would like to clarify that Gadotti & de Sá-Freitas (2025) already used the updated values in their analysis of nuclear disc scaling relations.
Updated nuclear disc masses.
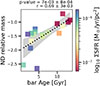 |
Fig. 1. Updated nuclear disc mass buildup. In this plot, we present the updated result from de Sá-Freitas et al. (2025) of the nuclear disc mass normalized by the galaxy mass for different bar ages, colour-coding each point according to its ΣSFR, which increases towards blue colours (original Figure 9). The updated result is qualitatevely the same, as the bars age, the nuclear discs gradually become less star-forming and their masses increase (updated correlation coefficient 0.7 ± 2 × 10⁻³ and p-value = 7 × 10⁻³ ± 8 × 10⁻⁴). |
References
- de Sá-Freitas, C., Gadotti, D. A., Fragkoudi, F., et al. 2023, A&A, 678, A202 [NASA ADS] [CrossRef] [EDP Sciences] [Google Scholar]
- de Sá-Freitas, C., Gadotti, D. A., Fragkoudi, F., et al. 2025, A&A, 698, A5 [NASA ADS] [CrossRef] [EDP Sciences] [Google Scholar]
- Gadotti, D. A., & de Sá-Freitas, C. 2025, MNRAS, 544, L58 [Google Scholar]
© The Authors 2025
 Open Access article, published by EDP Sciences, under the terms of the Creative Commons Attribution License (https://creativecommons.org/licenses/by/4.0), which permits unrestricted use, distribution, and reproduction in any medium, provided the original work is properly cited.
This article is published in open access under the Subscribe to Open model. This email address is being protected from spambots. You need JavaScript enabled to view it. to support open access publication.
All Tables
All Figures
|
Fig. 1. Updated nuclear disc mass buildup. In this plot, we present the updated result from de Sá-Freitas et al. (2025) of the nuclear disc mass normalized by the galaxy mass for different bar ages, colour-coding each point according to its ΣSFR, which increases towards blue colours (original Figure 9). The updated result is qualitatevely the same, as the bars age, the nuclear discs gradually become less star-forming and their masses increase (updated correlation coefficient 0.7 ± 2 × 10⁻³ and p-value = 7 × 10⁻³ ± 8 × 10⁻⁴). |
| In the text | |
Current usage metrics show cumulative count of Article Views (full-text article views including HTML views, PDF and ePub downloads, according to the available data) and Abstracts Views on Vision4Press platform.
Data correspond to usage on the plateform after 2015. The current usage metrics is available 48-96 hours after online publication and is updated daily on week days.
Initial download of the metrics may take a while.