Fig. 2.
Download original image
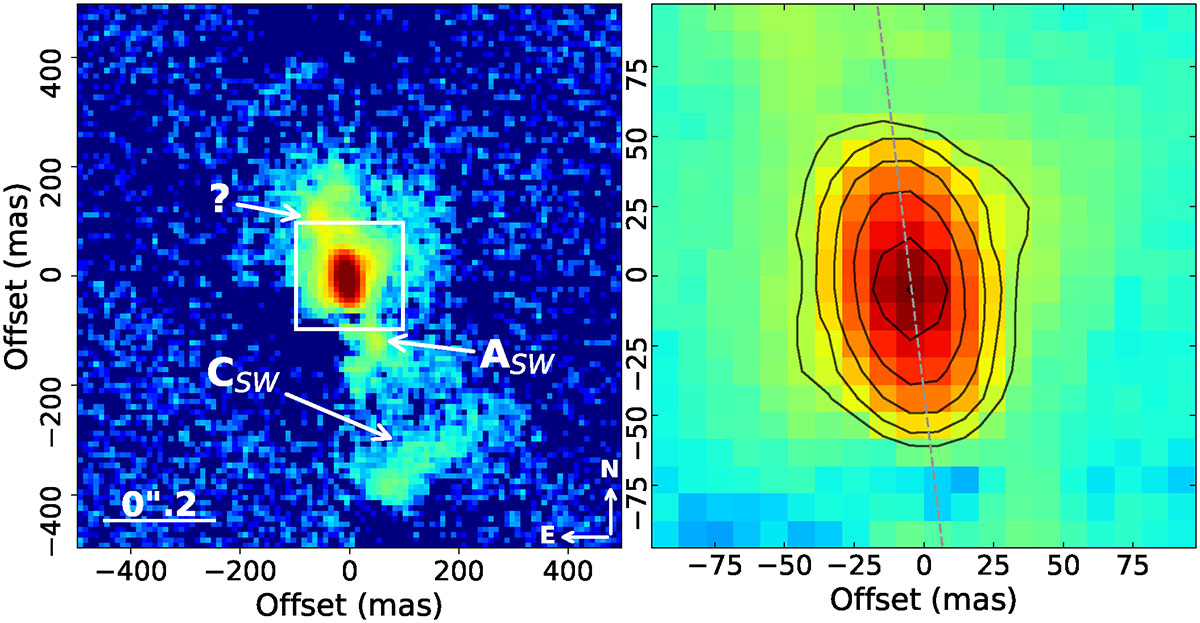
Left: Zorro Hα image with identified features marked. Right: Zoom into the central area with contours added. The dashed line shows the PA 186.9°. The origin of the axes represents the geometric centre of R Aqr. Contours are drawn at relative flux levels (F) of 0.03 × 2n, where n = 0, 1, 2, 3, and 4. North is up, and east is to the left.
Current usage metrics show cumulative count of Article Views (full-text article views including HTML views, PDF and ePub downloads, according to the available data) and Abstracts Views on Vision4Press platform.
Data correspond to usage on the plateform after 2015. The current usage metrics is available 48-96 hours after online publication and is updated daily on week days.
Initial download of the metrics may take a while.