| Issue |
A&A
Volume 704, December 2025
|
|
|---|---|---|
| Article Number | L11 | |
| Number of page(s) | 6 | |
| Section | Letters to the Editor | |
| DOI | https://doi.org/10.1051/0004-6361/202557825 | |
| Published online | 05 December 2025 | |
Letter to the Editor
Newborn jet in the symbiotic system R Aquarii
1
Tartu Observatory, University of Tartu, Observatooriumi 1, Tõravere 61602, Estonia
2
Physical Research Laboratory, Ahmedabad, Gujarat 380009, India
3
Observatorio Astronómico Nacional (OAN-IGN), Alfonso XII, 3, 28014 Madrid, Spain
4
NASA Ames Research Center, Moffett Field, CA 94035, USA
5
INAF National Institute of Astrophysics, Astronomical Observatory of Padova, 36012 Asiago (VI), Italy
6
MN Institute for Astrophysics, 116 Church Street, SE University of Minnesota, Minneapolis, MN 55455, USA
7
Astrophysics Research Centre, Lennard Jones Laboratories, Keele University, Keele, Staffordshire ST5 5BG, UK
8
NASA Exoplanet Science Institute, Caltech/IPAC, Mail Code 100-22, 1200 E. California Blvd., Pasadena, CA 91125, USA
9
Gemini Observatory/NSF’s NOIRLab, 670 N. A‘ohoku Place, Hilo, HI 96720, USA
10
The CHARA Array of Georgia State University, Mount Wilson Observatory, Mount Wilson, CA 91203, USA
11
Earth and Space Exploration, Arizona State University, P.O. Box 876004 Tempe, AZ 85287-6004, USA
★ Corresponding author: This email address is being protected from spambots. You need JavaScript enabled to view it.
Received:
24
October
2025
Accepted:
17
November
2025
Abstract
Context. R Aquarii (R Aqr) is a well-known symbiotic binary that attracted renewed interest during its recent periastron passage, an event that occurs only once every ∼40 years. This passage marks the first to be observed with modern, state-of-the-art instruments.
Aims We investigated the inner, sub-arcsecond active region of R Aqr during this recent periastron passage, with the goal of gaining insight into the jet-launching mechanisms at work in this system.
Methods. We analysed Hα speckle interferometric images obtained one month apart using Fourier techniques. These are complemented by high-resolution optical spectra in the same emission line.
Results. Our speckle imaging reveals a newborn two-sided jet orientated in the north–south direction. Its proper motion, 66 ± 19 mas yr−1, confirms that it was launched around 2020 January 7, at the onset of the periastron passage. Further analysis of the elongated central structure reveals a knot in the southern counterpart of the jet moving away from the binary with μ = 27 ± 17 mas yr−1 at a position angle of 187° and an ejection time around 2019 October 28. This interpretation is further supported by our high-resolution spectroscopic data. In addition, we update the expansion parallax distance of R Aqr to 260 pc.
Key words: binaries: symbiotic / circumstellar matter / ISM: jets and outflows / ISM: kinematics and dynamics / ISM: individual objects: R Aquarii
© The Authors 2025
 Open Access article, published by EDP Sciences, under the terms of the Creative Commons Attribution License (https://creativecommons.org/licenses/by/4.0), which permits unrestricted use, distribution, and reproduction in any medium, provided the original work is properly cited.
This article is published in open access under the Subscribe to Open model. This email address is being protected from spambots. You need JavaScript enabled to view it. to support open access publication.
1. Introduction
R Aquarii (R Aqr) is a symbiotic binary consisting of a Mira-type variable star with a pulsation period of 387 days (Belczyński et al. 2000; Gromadzki & Mikołajewska 2009) and a white dwarf (WD) companion. At a distance of ∼200 pc, it is one of the closest and most studied symbiotic binaries, yet it exhibits a wide range of intriguing phenomena.
The system has an orbital period of 42–44 years (e.g. Gromadzki & Mikołajewska 2009; Alcolea et al. 2023), with the WD coincidentally at inferior conjunction during each periastron passage. The most recent passage has just concluded. The periastron passage has been proposed to enhance mass transfer from the Mira variable to the WD, potentially triggering jet ejections (Kafatos & Michalitsianos 1982). However, other studies suggest that jet activity may not be directly related to the periastron passage (Gromadzki & Mikołajewska 2009).
The periastron passage is also reflected in the long-term light curve of R Aqr, where the peak visual brightness of the Mira star pulsations diminishes by a few magnitudes every ∼40 years (Fig. 1). This dimming is attributed to increased mass transfer and enhanced dust production (Omelian et al. 2025) obscuring the Mira variable. These dimming episodes typically last 6–7 years. The most recent event occurred between late 2018/early 2019 and mid-2023, making it slightly shorter than average. Although the WD alone is too small to eclipse the Mira star for such an extended period, the WD with its accretion disc may cause prolonged obscuration (Liimets et al. 2021).
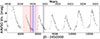 |
Fig. 1. Light curve of R Aqr. Black lines mark Zorro observations. Blue and red lines indicate the ejection of the newborn jet and the knot, respectively. Shaded regions indicate uncertainties. |
The binary is surrounded by a complex system of outflows (e.g. Lampland 1922; Solf & Ulrich 1985; Liimets et al. 2018 (L18); Santamaría et al. 2024), including the most recently formed component, the jet (e.g. Schmid et al. 2017 (S17); Bujarrabal et al. 2018). While some of these outflows extend several arcminutes from the central source, for example L18, this study focuses on the active, inner sub-arcsecond region during the latest periastron passage. This marks the first time that such activity around R Aqr’s periastron can be studied with modern, high-resolution observational facilities, as the previous periastron occurred about four decades ago.
2. Observations and data reduction
R Aqr and the standard star HR 8987 were observed under programme GS-2020B-Q-112 using the speckle imager Zorro (Scott et al. 2021) at Gemini South in the Hα 656/3.22 nm and 832/40 nm filters. Observations were obtained on 2020 October 31 and 2020 November 27, respectively, under the excellent seeing conditions specified in Table 1. Forty-eight sets of exposures were taken simultaneously in both filters each night. Each set comprised 1000 frames, each with a duration of 0.06 seconds. The field of view of our observations was  with a pixel scale of 9.758 mas pix−1 and 10.036 mas pix−1 for the Hα and 832 filters, respectively. HR 8987 was observed before, in the middle, and after the long sequence on R Aqr and was used in the data reduction process, which was done using Fourier techniques in a standard pipeline (e.g. Howell et al. 2011; Horch et al. 2012). The 48 datasets were broken into 3 groups of 16 sets each, and these groups were reduced separately. This was done to verify the existence of features. More details of the data reduction and interpretation techniques can be found on the Gemini-Zorro web pages1. Complementary spectra are reported in Appendix A.
Results of the Fourier analysis of the Hα filter data.
3. Detection of the newborn two-sided jet
In Fig. 2 we present the final combined Zorro Hα image from 2020 November 27, together with a zoomed-in view of the central area. All three groups of data collected on both dates show the same structures; therefore, we present only an image from one date in this paper. In addition, the consistent features of all groups confirm that the detected emission is real and not processing artefacts. Several previously known features are evident and further justify our proper image processing, such as features ASW and CSW identified from a SPHERE2 2014 Hα image by S17. In addition, there is a clear detection of the feature labelled as a question mark by Bujarrabal et al. (2021). The morphological appearances of all these features have not changed since their previous observations. We will discuss these features in a forthcoming paper. The focus of this paper is the elongated central area.
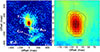 |
Fig. 2. Left: Zorro Hα image with identified features marked. Right: Zoom into the central area with contours added. The dashed line shows the PA 186.9°. The origin of the axes represents the geometric centre of R Aqr. Contours are drawn at relative flux levels (F) of 0.03 × 2n, where n = 0, 1, 2, 3, and 4. North is up, and east is to the left. |
The central area is elongated at a position angle (PA; measured from north towards east) of 186.9 ± 2.8°. To quantify this elongation, we plotted the profile cuts along the major and minor axes of this elongated area for all datasets on both dates (Fig. 3). Profiles were extracted with IRAF3 (Tody 1986, 1993) using the task PVECTOR along the major and minor axes. The orientation of the cuts is such that the left side is the northern part in profile cuts along the major axis, and the eastern part in cuts along the minor axis. The profiles were averaged, and their width is 7 pixels along the major axis and 11 pixels along the minor axis, covering the entire elongated area. It is clear from Fig. 3 that on both dates and in all data groups, the major axis profiles have consistently wider full widths at half maximum compared to the narrower minor axis profiles, indicating an extended emitting region towards the north and south. The extended wings on both sides reached up to 5.5 ± 0.1 pixels from the centre on 31 October (dotted lines), while they extended up to 6.0 ± 0.1 pixels on November 26 (solid lines), respectively 53.7 mas and 58.5 mas considering Zorro’s pixel size (Sect. 2). This is a clear indication that the symmetric extended area around the bright central source expanded between our two observing dates, which, in turn, indicates the presence of two-sided ejecta from the central source. The total extent of the two-sided jet is 107 mas in our first epoch and 117 mas in the second. The proper motion, μ, of the edges of the newborn two-sided jet is 66 ± 19 mas yr−1, which translates to a tangential velocity (vsky) of 81 ± 24 km s−1, according to the formula vsky [km s−1] = 4.74 ⋅ μ [″ yr−1]⋅D [pc], and taking our new distance estimate of D = 260 pc into account (see Appendix B). The measured velocity of 81 km s−1 and the near north–south (NS) jet morphology are consistent with previous observations of both the small- and large-scale jets of R Aqr (e.g. Hollis et al. 1999a; Mäkinen et al. 2004; S17; L18; Huang et al. 2023). When assuming a ballistic expansion, the ejection time is 2020 January 7 (2020.02 ± 0.26; JD = 2458856 ± 95), which aligns well with the onset of the periastron passage and, therefore, is consistent with previous suggestions that the periastron passage is the time when the jet is actively being launched (Kafatos & Michalitsianos 1982). This date is marked in blue in Figs. 1 and 4.
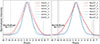 |
Fig. 3. Profile cuts along the major (red) and minor (blue) axes of the central elongated area for both Zorro dates. Profile cuts are centred at the Gaussian fit and flux-normalised. |
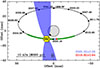 |
Fig. 4. Latest orbital solution of R Aqr. Small black dots trace the WD orbit around the Mira variable (grey circle) in 0.1-phase steps, with the corresponding dates in black. Zorro observing epochs (2020.82 and 2020.91) are marked by yellow hexagons. The green segment marks the recent periastron passage (2018.9–2023.3); the blue dot indicates the time of the two-sided jet, and the red one the time of the knot ejection. The two-sided jet is schematically drawn in blue. The black star marks the system’s geometric centre, and black circles show the knot positions at two epochs, October 31 and November 27. North is up, and east is to the left. |
To further support our interpretation of two-sided jet ejection, we examined the possibility that the elongated central structure is influenced by the binary components. For this purpose, in Fig. 4 we plot the latest orbital solution of R Aqr by Alcolea et al. (2023). Considering the estimated position of the WD and its accretion disc during our Zorro observations (distance of ∼10 mas and a PA between 132.9° and 140.5° from the Mira star; yellow hexagons), the profile cuts in the direction of the minor axes could indeed be affected. However, as can be seen, the minor axis profiles are not blended, and their full widths at half maximum are narrower than the major axis profiles. Based on this, we conclude that our Zorro observations do not resolve the binary components and, therefore, that the positions of the binary components do not affect our results.
We also note that the 832 nm filter image (Fig. C.1) shows a point source at the location of R Aqr. This wavelength is largely dominated by the primary, confirming that the elongated structure observed in Hα is related to the jet activity. Therefore, we conclude that we have detected a newly formed two-sided jet in the innermost region of R Aqr.
4. Knot inside the two-sided jet
We also performed a Fourier analysis, consistently finding a fainter object in Hα next to the bright source on both dates and in all three data groups. The results of this analysis are presented in Table 1. Our measuring errors of individual distances are 0.5 mas, which were used for the average combined error. The detected object was 27.3 ± 0.9 mas and 29.3 ± 0.9 mas from the central bright source on October 31 and November 27, respectively. According to the errors, the PA on both dates does not change and is, on average, 186.9 ± 2.8°. The positions of this feature are plotted with black circles in Fig. 4. We note, as we do not resolve the central binary in our images, that the positions are plotted from the geometric centre of the binary, which is marked with a black star (we are implicitly assuming that the WD and the primary equally contribute to the central Hα emission). According to measurements made on the reconstructed images, the detected source is fainter in Hα than the bright nearby source, which is the unresolved central binary. This fainter object is not detected in the continuum image.
It is evident that the detected object is moving away from the central binary within the recently formed two-sided jet, whose overall extent from the central source is approximately twice the distance to the feature. This suggests that the observed structure corresponds to a localised enhancement of material within the jet, which we designate as a knot.
With this in mind, we performed some numerical calculations. To estimate the expansion velocity of the knot in the plane of the sky, we averaged the three measurements obtained from different data groups for each epoch (the Julian date is indicated for each data group in the fourth rows of Table 1). Assuming that the PA does not change within our error estimates, we find that, between our two dates, the knot travelled 2.0 ± 1.2 mas. From this, we calculated its proper motion to be 27 ± 17 mas yr−1, which translates to a tangential velocity (vsky) of 33 ± 21 km s−1. This value is in agreement with previously measured velocities in both the inner and outer jets of R Aqr. The seemingly large uncertainties in the above calculations are due to the small travelled distance. Assuming that the velocity of the knot has not changed, we obtain an age of 1.01 ± 0.64 years at our first observing date. This implies the ejection date was 2019 October 28 (2019.82 ± 0.64; JD = 2458785 ± 234), which also aligns with the start of the periastron passage. This date, together with the relevant errors, is marked in red in Figs. 1 and 4.
5. Discussion and conclusions
To provide additional evidence of recent jet activity in R Aqr, we studied a series of high-resolution Hα spectra (see Fig. A.1). All radial velocities (RVs) have been corrected for the average local standard of rest systemic velocity of R Aqr (−24.9 km s−1; Gromadzki & Mikołajewska 2009) such that the zero point in the plots corresponds to the systemic velocity. Figure A.1 shows that the Hα emission line in 2012 and 2013 exhibits a single narrow profile centred near the systemic velocity. By the end of 2013, the line peak shifts slightly bluewards, and by 2019 the profile becomes increasingly asymmetric towards redder wavelengths. These changes culminate in a clearly double-peaked profile by late 2024, with a range of peak velocities between −43.5 km s−1 and +21.6 km s−1. Such a double-peaked profile could indicate (i) bipolar mass-loss activity, such as the launching of a two-sided jet, and/or (ii) contributions from the orbital motion of the central binary. Over the 12 years of our spectral observations, the orbital RV amplitude of the central binary does not exceed 4 km s−1 (Gromadzki & Mikołajewska 2009); the latter possibility is therefore ruled out. However, the well-established presence of a two-sided jet in the R Aqr system (e.g. Hollis et al. 1999b; L18; Santamaría et al. 2024) provides a natural explanation for the range of peak velocities observed in 2024. L18 measured peak RVs ranging from about −40 to +140 km s−1 for the large-scale jet, which is consistent with our new measurements.
Lucas et al. (2024) present a high-spatial-resolution Hα image of R Aqr obtained on 2023 July 7 with VAMPIRES4. Taken 3.5 years after the proposed two-sided jet ejection, this observation provides valuable insight into the subsequent jet evolution. However, we remain cautious about their results: as noted by the authors, the WD is not detected, and the bright clump north of its expected position is attributed to new jet activity (see their Fig. 26). Given that previous observations (S17) show strong emission at this wavelength, we find no clear reason for the WD’s absence in Hα, except perhaps enhanced dust production during the periastron passage, which would provide additional extinction in the orbital plane but not so much along the polar directions. In any case, regardless of the WD position and the nearby northern feature, the faint north-eastern extension (upper-left corner in Fig. 26 of Lucas et al. 2024), considering the found μ = 66 mas yr−1, could correspond to the 2020.02 ejection, while the weak southern counterpart aligns with the temporal asymmetry typically seen in R Aqr jets (S17; L18). This asymmetry in 2023 is further supported by our spectral observations (Fig. A.1).
Lastly, the ejection times of the newborn two-sided jet (2020.02) and the knot (2019.82) clearly indicate that the launching of material from the central binary is associated with the periastron passage. Within the uncertainties (see the shaded areas in Fig. 1), the ejection times are consistent with a nearly simultaneous event; however, it is possible that the slower-moving knot was ejected slightly earlier, followed shortly thereafter by the faster, two-sided outflow. This scenario is consistent with the knotty morphology and the observed range of expansion velocities of the R Aqr jet (e.g. S17; L18). Furthermore, such a jet morphology is in agreement with hydrodynamic simulations of the jet activity in symbiotic systems (e.g. Stute et al. 2005).
In conclusion, we have presented clear evidence of NS two-sided jet activity in R Aqr during the recent periastron passage, confirming earlier suggestions that jet-launching in this system occurs near periastron. This marks the first detection of the hot gas jet component so close to the central binary, revealing ejections from the accretion disc surrounding the WD. Continued monitoring will be crucial for tracing and understanding the evolution of this newborn jet, and will offer a rare opportunity to observe freshly ejected material in such a complex and dynamic system.
The Spectro-Polarimetric High-contrast Exoplanet REsearch instrument at the VLT.
IRAF was written at the National Optical Astronomy Observatory, which was operated by the Association of Universities for Research in Astronomy (AURA) under cooperative agreement with the National Science Foundation.
Visible Aperture-Masking Polarimetric Imager/Interferometer for Resolving Exoplanetary Signatures; (Norris et al. 2015).
Re-normalised unit weight error. Ruwe is expected to be around 1.0 for sources where the single-star model provides a good fit to the astrometric observations. A value significantly greater than 1.0 (e.g., >1.4) could indicate that the source is non-single or otherwise problematic for the astrometric solution.
Per cent of successful-IPD windows with more than one peak.
Acknowledgments
We thank the referee for their supportive report. Observations in this paper made use of the High-Resolution Imaging instrument Zorro and were obtained under Gemini program GS-2020B-Q-112. Zorro was funded by the NASA Exoplanet Exploration Program and built at the NASA Ames Research Center by Steve B. Howell, Nic Scott, Elliott P. Horch, and Emmett Quigley. Zorro was mounted on the Gemini South telescope of the International Gemini Observatory, a program of NSF’s NOIR Lab, which is managed by the Association of Universities for Research in Astronomy (AURA) under a cooperative agreement with the National Science Foundation on behalf of the Gemini partnership: the National Science Foundation (United States), National Research Council (Canada), Agencia Nacional de Investigación y Desarrollo (Chile), Ministerio de Ciencia, Tecnología e Innovación (Argentina), Ministério da Ciência, Tecnologia, Inovações e Comunicações (Brazil), and Korea Astronomy and Space Science Institute (Republic of Korea). This project has received funding from the European Union’s Horizon Europe research and innovation programme under grant agreement No. 101079231 (EXOHOST), and from UK Research and Innovation (UKRI) under the UK government’s Horizon Europe funding guarantee (grant number 10051045). This work has been partially supported by the I+D+i PID2023-146056NB-C21 (CRISPNESS/MESON), funded by the AEI (10.13039/501100011033) of the Spanish MICIU and the European Regional Development Fund (ERDF) of the EU. This research made use of the NASA Astrophysics Data System (ADS) and of the SIMBAD database, which is operated at CDS, Strasbourg, France. This work has been in part supported by INAF 2023 MiniGrant Program (contract C93C23008470001 to UM). We acknowledge with thanks the variable star observations from the AAVSO International Database contributed by observers worldwide and used in this research. SS acknowledges partial support from a NASA Emerging Worlds grant to ASU (80NSSC22K0361) as well as support from his ASU Regents’ Professorship monies. RDG was supported, in part, by the United States Air Force.
References
- Alcolea, J., Mikolajewska, J., Gómez-Garrido, M., et al. 2023, in Highlights on Spanish Astrophysics XI, eds. M. Manteiga, L. Bellot, P. Benavidez, et al., 190 [Google Scholar]
- Baade, W. 1944, Mount Wilson Obs. Ann. Rep., 16, 12 [Google Scholar]
- Bailer-Jones, C. A. L., Rybizki, J., Fouesneau, M., Demleitner, M., & Andrae, R. 2021, AJ, 161, 147 [Google Scholar]
- Belczyński, K., Mikołajewska, J., Munari, U., Ivison, R. J., & Friedjung, M. 2000, A&AS, 146, 407 [NASA ADS] [CrossRef] [EDP Sciences] [Google Scholar]
- Bujarrabal, V., Alcolea, J., Mikołajewska, J., Castro-Carrizo, A., & Ramstedt, S. 2018, A&A, 616, L3 [NASA ADS] [CrossRef] [EDP Sciences] [Google Scholar]
- Bujarrabal, V., Agúndez, M., Gómez-Garrido, M., et al. 2021, A&A, 651, A4 [NASA ADS] [CrossRef] [EDP Sciences] [Google Scholar]
- Gromadzki, M., & Mikołajewska, J. 2009, A&A, 495, 931 [NASA ADS] [CrossRef] [EDP Sciences] [Google Scholar]
- Hinkle, K. H., Lebzelter, T., & Straniero, O. 2016, ApJ, 825, 38 [NASA ADS] [CrossRef] [Google Scholar]
- Hollis, J. M., Bertram, R., Wagner, R. M., & Lampland, C. O. 1999a, ApJ, 514, 895 [Google Scholar]
- Hollis, J. M., Vogel, S. N., Van Buren, D., et al. 1999b, ApJ, 522, 297 [Google Scholar]
- Horch, E. P., Howell, S. B., Everett, M. E., & Ciardi, D. R. 2012, AJ, 144, 165 [NASA ADS] [CrossRef] [Google Scholar]
- Howell, S. B., Everett, M. E., Sherry, W., Horch, E., & Ciardi, D. R. 2011, AJ, 142, 19 [Google Scholar]
- Huang, C. D., Karovska, M., Hack, W., et al. 2023, ApJ, 947, 11 [Google Scholar]
- Kafatos, M., & Michalitsianos, A. G. 1982, Nature, 298, 540 [Google Scholar]
- Lampland, C. O. 1922, Publ. Am. Astron. Soc., 4, 319 [Google Scholar]
- Liimets, T., Corradi, R. L. M., Jones, D., et al. 2018, A&A, 612, A118 [NASA ADS] [CrossRef] [EDP Sciences] [Google Scholar]
- Liimets, T., Corradi, R. M. L., Jones, D., et al. 2021, in The Golden Age of Cataclysmic Variables and Related Objects V, 2–7, 41 [Google Scholar]
- Lucas, M., Norris, B., Guyon, O., et al. 2024, PASP, 136, 114504 [Google Scholar]
- Mäkinen, K., Lehto, H. J., Vainio, R., & Johnson, D. R. H. 2004, A&A, 424, 157 [NASA ADS] [CrossRef] [EDP Sciences] [Google Scholar]
- Min, C., Matsumoto, N., Kim, M. K., et al. 2014, PASJ, 66, 38 [Google Scholar]
- Norris, B., Schworer, G., Tuthill, P., et al. 2015, MNRAS, 447, 2894 [NASA ADS] [CrossRef] [Google Scholar]
- Omelian, E., Sankrit, R., Goldman, S., & Gorti, U. 2025, ApJ, 984, 128 [Google Scholar]
- Santamaría, E., Toalá, J. A., Liimets, T., et al. 2024, MNRAS, 532, 2511 [Google Scholar]
- Schmid, H. M., Bazzon, A., Milli, J., et al. 2017, A&A, 602, A53 [NASA ADS] [CrossRef] [EDP Sciences] [Google Scholar]
- Scott, N. J., Howell, S. B., Gnilka, C. L., et al. 2021, Front. Astron. Space Sci., 8, 138 [NASA ADS] [CrossRef] [Google Scholar]
- Solf, J., & Ulrich, H. 1985, A&A, 148, 274 [NASA ADS] [Google Scholar]
- Stute, M., Camenzind, M., & Schmid, H. M. 2005, A&A, 429, 209 [NASA ADS] [CrossRef] [EDP Sciences] [Google Scholar]
- Tody, D. 1986, SPIE Conf. Ser., 627, 733 [Google Scholar]
- Tody, D. 1993, ASP Conf. Ser., 52, 173 [NASA ADS] [Google Scholar]
- Whitelock, P. A., Feast, M. W., & Van Leeuwen, F. 2008, MNRAS, 386, 313 [CrossRef] [Google Scholar]
- Yang, H.-J., Park, M.-G., Cho, S.-H., & Park, C. 2005, A&A, 435, 207 [NASA ADS] [CrossRef] [EDP Sciences] [Google Scholar]
Appendix A: Complementary spectral observations
Complementary spectral observations were collected with the 1.82 m Asiago Echelle Spectrograph between the years 2012 and 2024. Twenty spectra were collected in the region of Hα with a spectral resolution R = 20000 and a typical exposure time of 3 × 300 seconds. The slit was 2″ wide and aligned with the NS direction. Given the low declination, R Aqr was always observed close to the meridian, and in such conditions, the NS orientation is always nearly coincident with the parallactic angle. Furthermore, the NS slit orientation ensures that all features visible in our Zorro images were included in the slit. Asiago spectra were reduced using standard routines in IRAF.
The Hα profiles are shown in Fig. A.1. All RVs have been corrected for the average systemic velocity of R Aqr (−24.9 km s−1; Gromadzki & Mikołajewska 2009), so that the zero point in the plots corresponds to the systemic velocity.
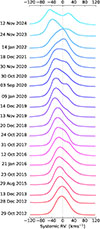 |
Fig. A.1. Hα line profiles of the Asiago spectra. The zero point represents the average systemic velocity of R Aqr, −24.9 km s−1. |
Appendix B: Revised expansion parallax
To have reliable values of physical sizes and tangential velocities, it is important to use an accurate distance to the object. Here, we re-examine the previously determined expansion parallax 178 ± 18 pc (L18). This value was computed using the magnification factor of the hour-glass nebula at the equator, and comparing it to the equatorial ring expansion velocity of vexp = 55 km s−1 modelled by Solf & Ulrich (1985). More recent morpho-kinematic analysis by Santamaría et al. (2024) used long-slit high resolution spectra, finding a considerably larger expansion velocity for the equatorial ring of vexp = 86 ± 5 km s−1. This prompts a new distance determination using the magnification factor by L18, and the size (r = 45.6 arcsec) and expansion velocity of the equatorial ring by Santamaría et al. (2024). Assuming a conservative error of 2″ for the size of the ring, and the standard deviation of the four measurements of the magnification by L18 as the uncertainty of the magnification factor, the expansion parallax distance to R Aqr is 260 ± 27 pc. Although slightly larger than our previous estimate, this value is in good agreement with several other determinations based on nebular kinematics: 260 pc (Baade 1944) and 2073 pc (Yang et al. 2005), as well as with the period–luminosity relation distance of 250 pc (Whitelock et al. 2008). Moreover, the revised distance aligns significantly better with the most recent orbital solution and binary parameters, leading to more plausible stellar masses.
According to the orbital solution by Alcolea et al. (2023), the total mas of the system is 3.3×(D(pc)/333)3. Min et al. (2014) derived a distance of 218 pc [208–230 pc] based on SiO masers VLBI parallax, resulting in a total mass of 1.0 M⊙ for the system, being both components about 0.5 M⊙. These values are unacceptably low, not to say those resulting from the previous estimate of 178 pc. Bailer-Jones et al. (2021) estimates a distance of 387 pc [343–436 pc] from GAIA DR3 results, but these measurements are not reliable according to several flags in the catalogue (ruwe5 and  6). In addition, a distance of 387 pc will result in a total mass of 5 M⊙ with a primary of 3.5 M⊙ and a WD mass of 1.5 (but with large errors) that are unacceptably high. On the contrary, for a distance of 260 pc, we get a total mass of 1.75 M⊙, with a primary of 1 M⊙ and a secondary of 0.75 M⊙, which implies that the secondary had an initial mass of about 3 M⊙ star. These numbers are much more plausible in view of other properties of the primary, such as its C/O abundance ratio less than one (R Aqr A is an O-rich Mira star), and the low 17O/18O ratio of 0.05 (Hinkle et al. 2016).
Appendix C: Continuum image
In Fig. C.1 we present a representative image obtained with the 832 nm filter on 2020 November 27. At this wavelength, the emission is primarily dominated by the Mira variable. The central source appears roughly round in shape.
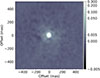 |
Fig. C.1. Zorro image obtained with the 832 nm filter. The sky area shown is the same as in the left panel of Fig. 2. North is up, and east is to the left. |
All Tables
All Figures
|
Fig. 1. Light curve of R Aqr. Black lines mark Zorro observations. Blue and red lines indicate the ejection of the newborn jet and the knot, respectively. Shaded regions indicate uncertainties. |
| In the text | |
|
Fig. 2. Left: Zorro Hα image with identified features marked. Right: Zoom into the central area with contours added. The dashed line shows the PA 186.9°. The origin of the axes represents the geometric centre of R Aqr. Contours are drawn at relative flux levels (F) of 0.03 × 2n, where n = 0, 1, 2, 3, and 4. North is up, and east is to the left. |
| In the text | |
|
Fig. 3. Profile cuts along the major (red) and minor (blue) axes of the central elongated area for both Zorro dates. Profile cuts are centred at the Gaussian fit and flux-normalised. |
| In the text | |
|
Fig. 4. Latest orbital solution of R Aqr. Small black dots trace the WD orbit around the Mira variable (grey circle) in 0.1-phase steps, with the corresponding dates in black. Zorro observing epochs (2020.82 and 2020.91) are marked by yellow hexagons. The green segment marks the recent periastron passage (2018.9–2023.3); the blue dot indicates the time of the two-sided jet, and the red one the time of the knot ejection. The two-sided jet is schematically drawn in blue. The black star marks the system’s geometric centre, and black circles show the knot positions at two epochs, October 31 and November 27. North is up, and east is to the left. |
| In the text | |
|
Fig. A.1. Hα line profiles of the Asiago spectra. The zero point represents the average systemic velocity of R Aqr, −24.9 km s−1. |
| In the text | |
|
Fig. C.1. Zorro image obtained with the 832 nm filter. The sky area shown is the same as in the left panel of Fig. 2. North is up, and east is to the left. |
| In the text | |
Current usage metrics show cumulative count of Article Views (full-text article views including HTML views, PDF and ePub downloads, according to the available data) and Abstracts Views on Vision4Press platform.
Data correspond to usage on the plateform after 2015. The current usage metrics is available 48-96 hours after online publication and is updated daily on week days.
Initial download of the metrics may take a while.