Open Access
Fig. 3.
Download original image
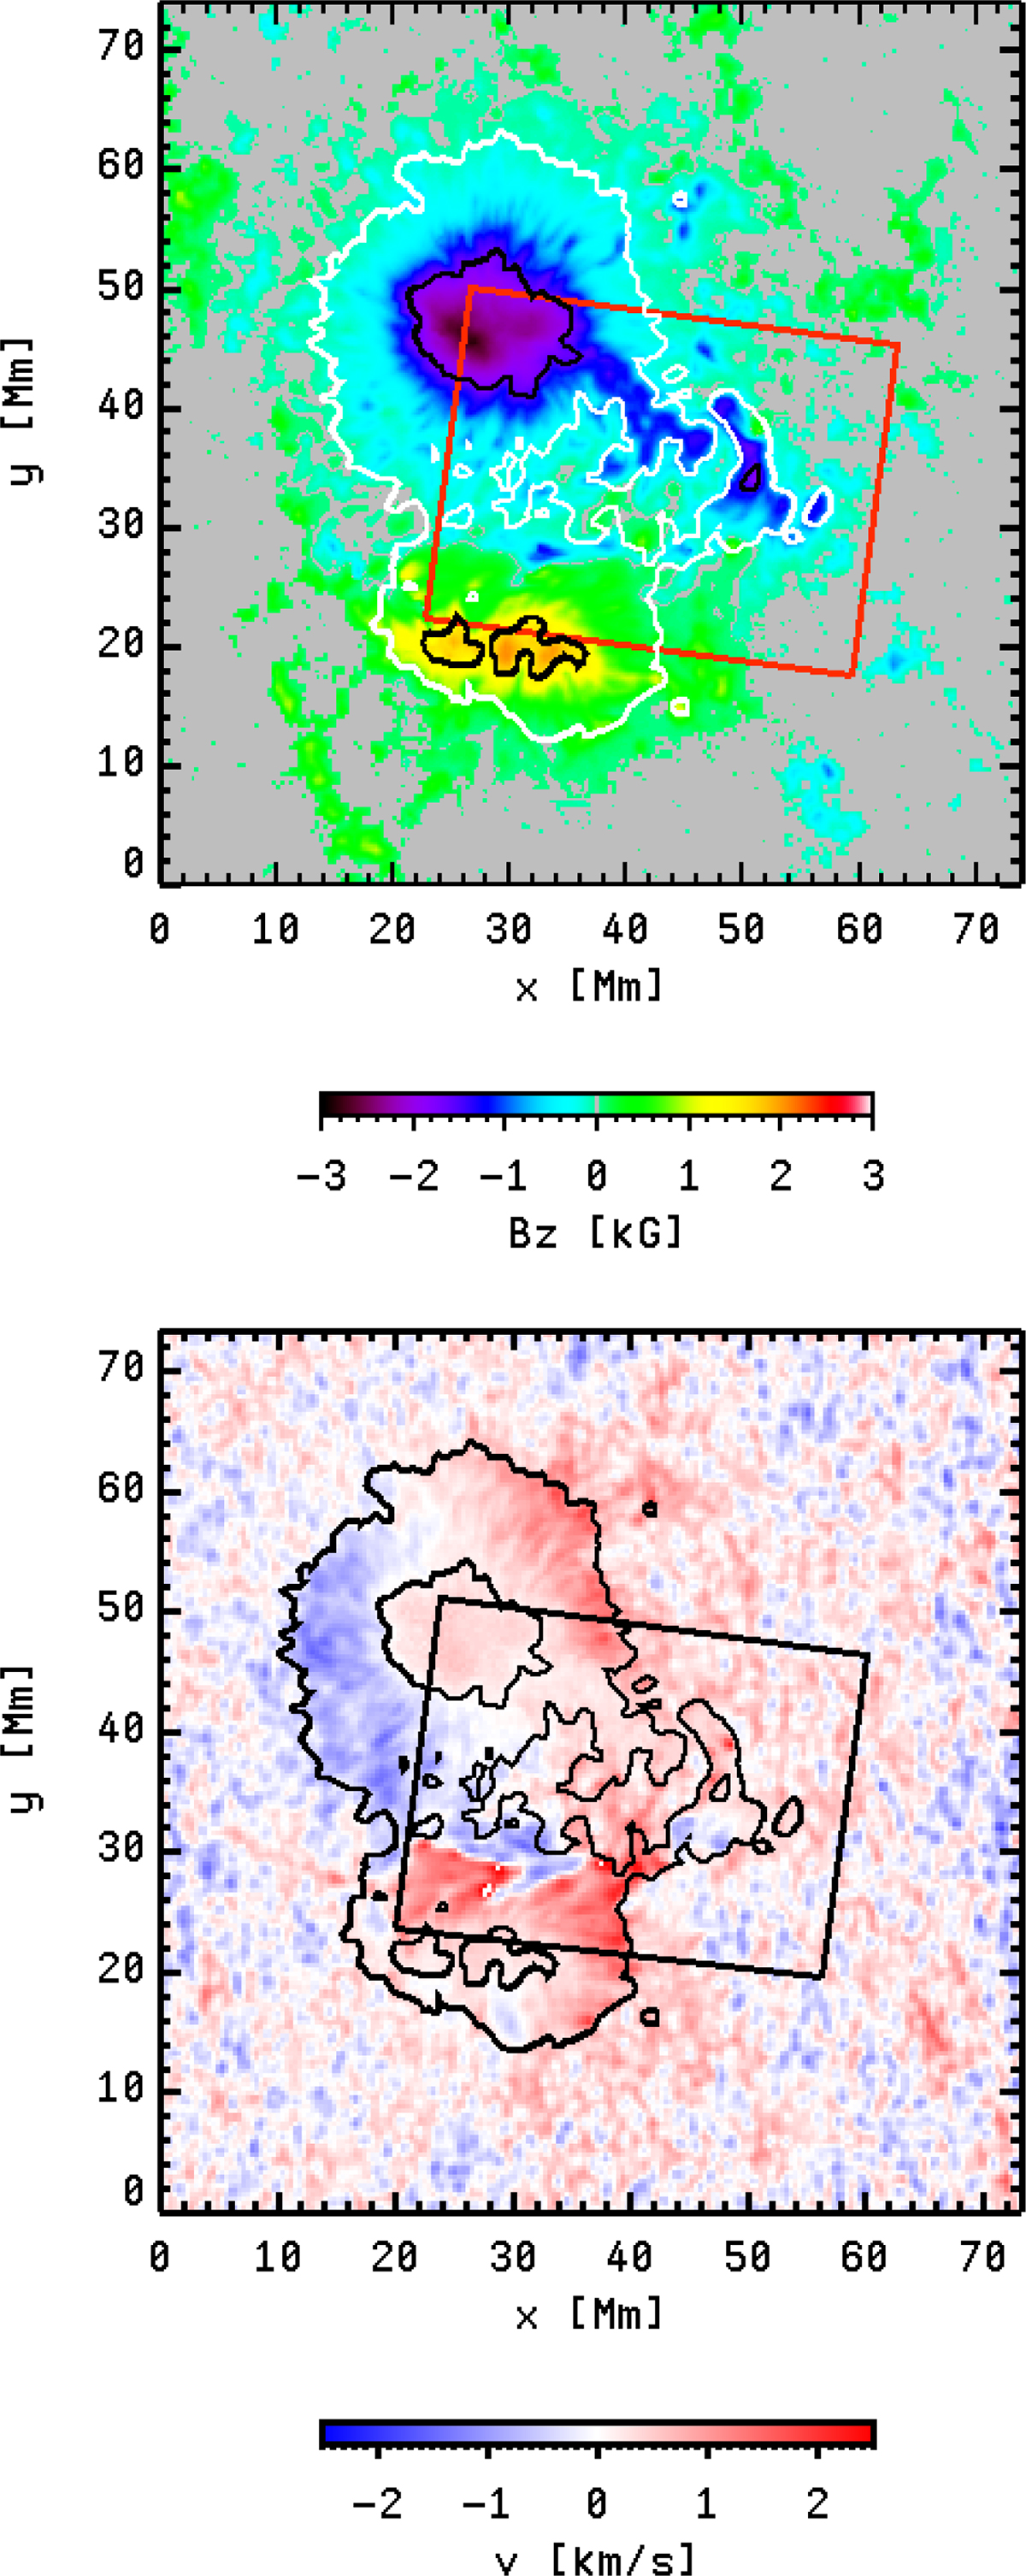
Upper: Vertical component of the magnetic field recorded by HMI at 09:48 UT on August 24. Black and white contours indicate the boundaries of the umbra and penumbra according to Fig. 1. Values are suppressed where the total magnetic field strength is below 150 G. Lower: Corresponding Doppler velocity from HMI.
Current usage metrics show cumulative count of Article Views (full-text article views including HTML views, PDF and ePub downloads, according to the available data) and Abstracts Views on Vision4Press platform.
Data correspond to usage on the plateform after 2015. The current usage metrics is available 48-96 hours after online publication and is updated daily on week days.
Initial download of the metrics may take a while.