Fig. 4.
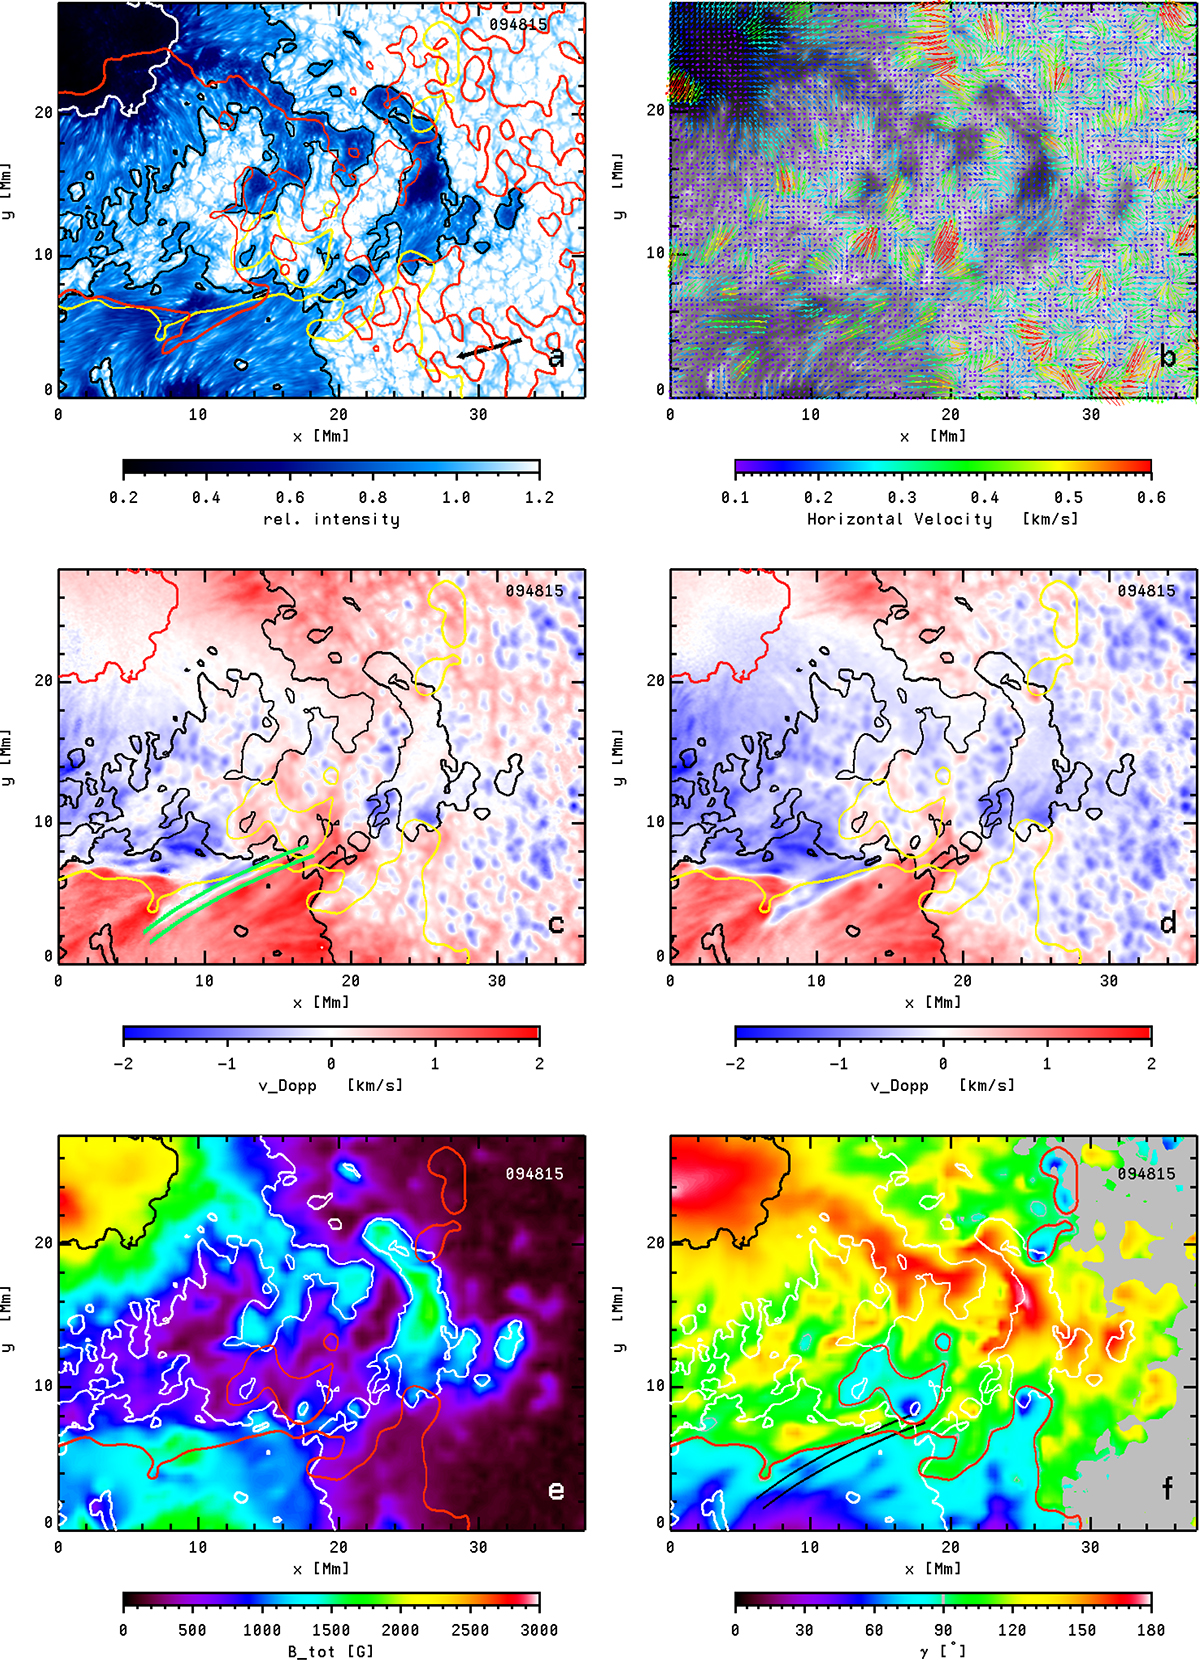
Download original image
(a): Speckle-restored blue continuum image of the investigated region obtained at GREGOR, restricted to the area recorded with the GFPI. The red contours mark the zero-velocity lines, and the yellow line the PIL. Black contours outline the outer penumbral boundary, and white the umbral–penumbral boundary. The arrow points to disk center (note the image is rotated compared to Fig. 1). (b): Horizontal velocity map obtained via the LCT. The color and length of the arrows indicate the velocity on a spectral scale (see the color bar). The average blue continuum image serves as the background. (c) and (d): Velocity maps, derived from polynomial fits (c) and from the Fourier method (d), applied to GFPI data. Red and black contours mark the umbra and penumbra according to the GFPI intensity map. The yellow line indicates the PIL. Here, trajectories of the high velocities shown in Fig. 5 are marked in light blue. (e): Total magnetic field strength. (f): Inclination of the magnetic field in the local frame of reference, taken from HMI. Black and white contours indicate the boundaries of the umbra and penumbra in the GFPI data. Values are set to 90° where the total magnetic field strength is below 150 G. The violet line marks the PIL. The trajectories are marked in panel f in black. An animation of panels c and d is available online.
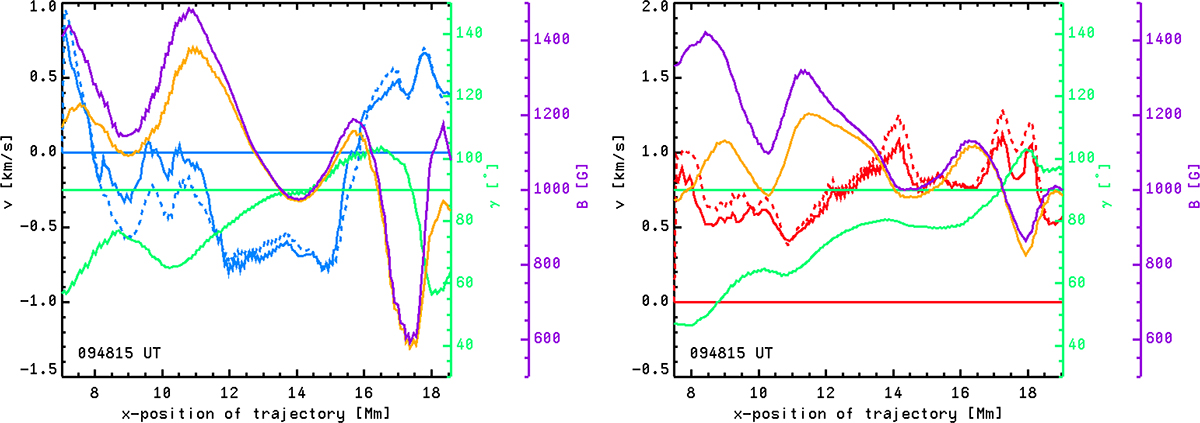
Fig. 5.
Left: parameters along the line with maximum blueshifts. We show Doppler velocities from the polynomial fit (solid blue lines), Doppler velocities from the Fourier method (dashed blue), the magnetic inclination (green), the total magnetic field strength (violet), and the horizontal magnetic field strength (orange). Horizontal lines mark the zero reference for velocities (blue) and 90° for the magnetic inclination (green). Right: parameters for the maximum redshift. Here, the velocities are displayed in red. An animation of this figure is available online.

Current usage metrics show cumulative count of Article Views (full-text article views including HTML views, PDF and ePub downloads, according to the available data) and Abstracts Views on Vision4Press platform.
Data correspond to usage on the plateform after 2015. The current usage metrics is available 48-96 hours after online publication and is updated daily on week days.
Initial download of the metrics may take a while.