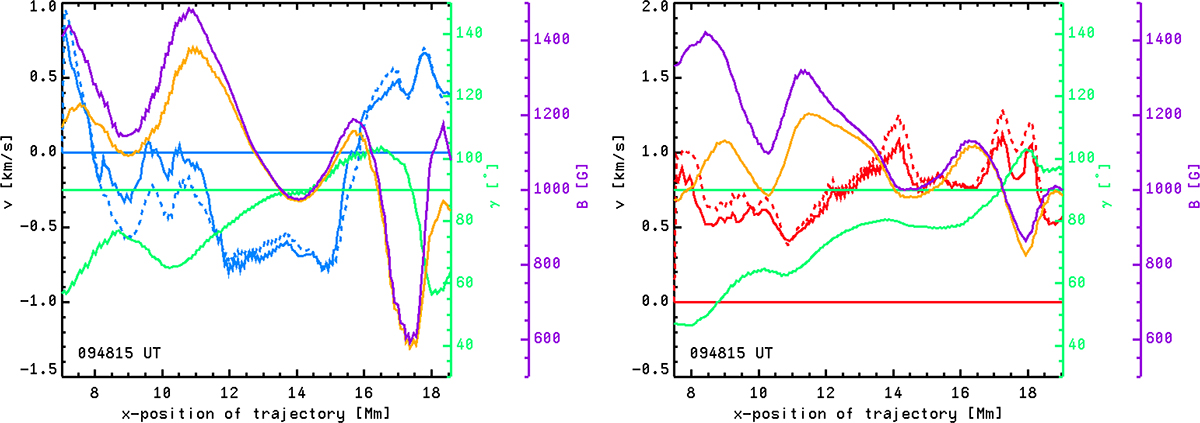
Fig. 5.
Download original image
Left: parameters along the line with maximum blueshifts. We show Doppler velocities from the polynomial fit (solid blue lines), Doppler velocities from the Fourier method (dashed blue), the magnetic inclination (green), the total magnetic field strength (violet), and the horizontal magnetic field strength (orange). Horizontal lines mark the zero reference for velocities (blue) and 90° for the magnetic inclination (green). Right: parameters for the maximum redshift. Here, the velocities are displayed in red. An animation of this figure is available online.
Current usage metrics show cumulative count of Article Views (full-text article views including HTML views, PDF and ePub downloads, according to the available data) and Abstracts Views on Vision4Press platform.
Data correspond to usage on the plateform after 2015. The current usage metrics is available 48-96 hours after online publication and is updated daily on week days.
Initial download of the metrics may take a while.