Fig. 4.
Download original image
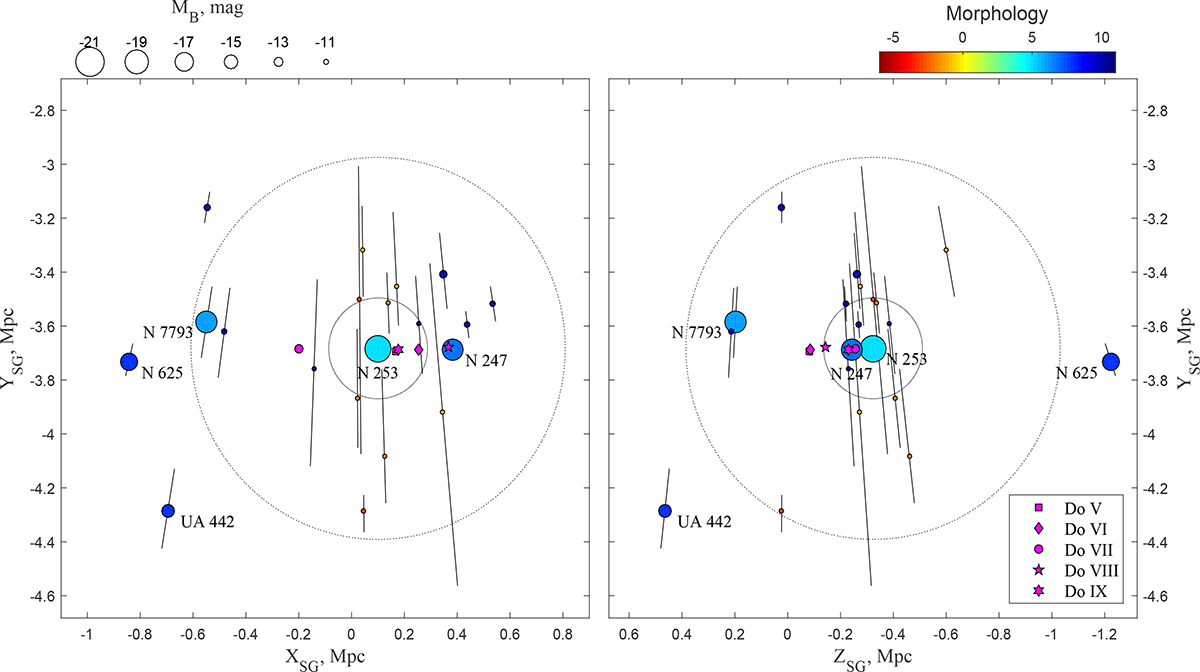
Distribution of galaxies around NGC 253 in supergalactic coordinates. Left-hand panel: Projection on the plane of the Local Supercluster. Right-hand panel: Its edge-on view. The sizes and colours of the dots reflect the B-band absolute magnitude and morphology of the galaxies, according to the legends above. The line segments correspond to the distance errors. The dotted circles mark the virial zone of R200 = 190 and the turn-around radius of Rta = 710 kpc around NGC 253. The expected positions of the discovered galaxies are indicated by magenta symbols.
Current usage metrics show cumulative count of Article Views (full-text article views including HTML views, PDF and ePub downloads, according to the available data) and Abstracts Views on Vision4Press platform.
Data correspond to usage on the plateform after 2015. The current usage metrics is available 48-96 hours after online publication and is updated daily on week days.
Initial download of the metrics may take a while.