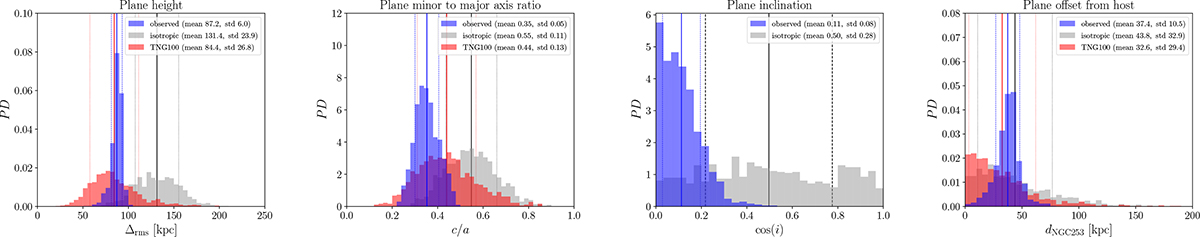
Fig. 6.
Download original image
Parameters of the ToI fit to the spatial distributions of galaxies with measured distances, that reside within 600 kpc of NGC 253. Shown are Δrms, the absolute rms plane height (far left); c/a, the minor-to-major axis ratio (middle left); i, the inclination of the best-fit plane with the line-of-sight (middle right); and dNGC 253, the perpendicular offset of the best-fit plane from NGC 253 (far right). Blue shows the realisations drawing from the observed galaxy distances. They are more flattened than randomised samples drawn from isotropic distributions with identical radial distributions (shown in grey). However, they appear to be consistent with the parameters of satellite systems in the cosmological IllustrisTNG-100 simulation (shown in red). The mean and standard deviations of the shown distributions are given in each panel.
Current usage metrics show cumulative count of Article Views (full-text article views including HTML views, PDF and ePub downloads, according to the available data) and Abstracts Views on Vision4Press platform.
Data correspond to usage on the plateform after 2015. The current usage metrics is available 48-96 hours after online publication and is updated daily on week days.
Initial download of the metrics may take a while.