Fig. 1
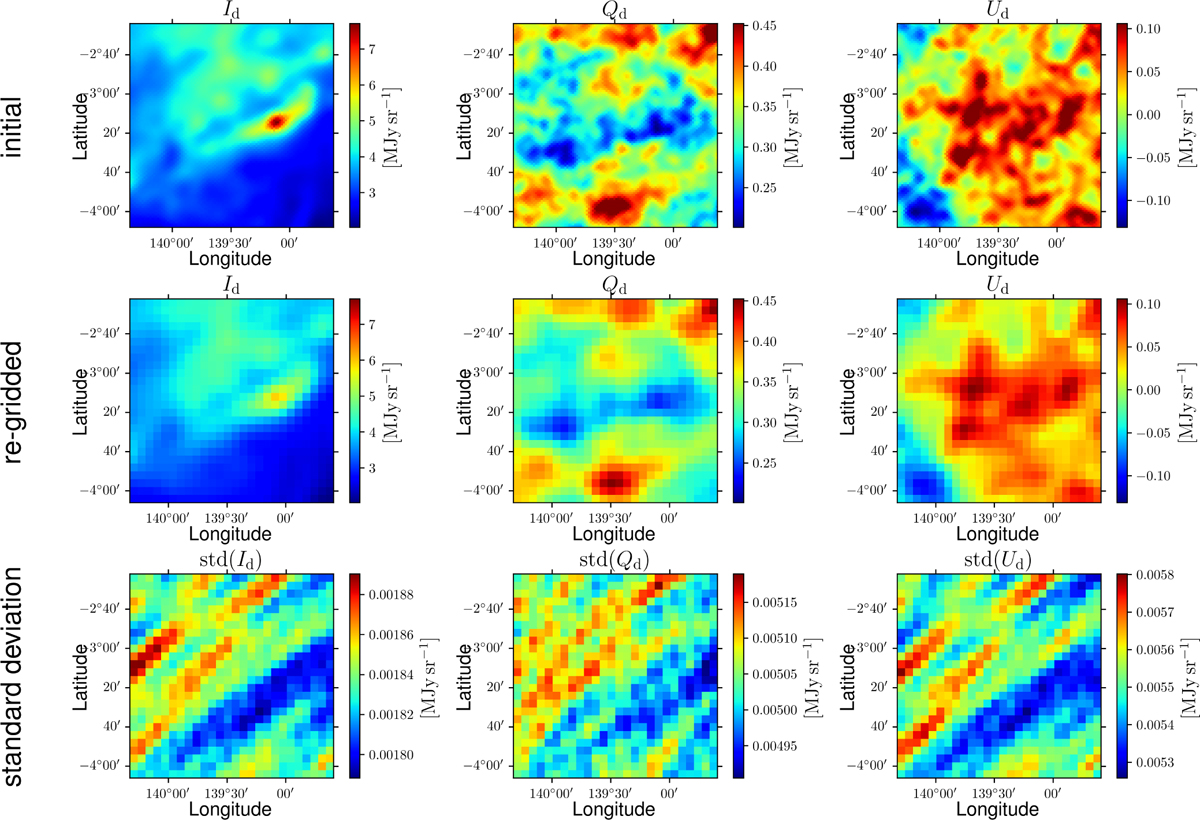
Download original image
Maps of the intensity, Id (left), and of the two Stokes parameters for linear polarization, Qd (middle) and Ud (right), of the polarized dust emission at 353 GHz toward the G139 region defined in the first paragraph of Sect. 3. Top row: observational maps from Planck (Planck Collaboration 2020b). Middle row: same maps resampled to the common 26 × 26 pixel grid of the gas tracers (pixel size = 4′). Bottom row: statistical uncertainties in the Planck maps resampled to the 26 × 26 pixel grid. The total uncertainties are equal to the quadratic sums of the statistical uncertainties and the photometric calibration uncertainties, which in turn are given by 0.0078 Id for Id(Planck Collaboration 2016b, 2020b) and 0.015 Pd for Qd and Ud (Planck Collaboration 2020b,c).
Current usage metrics show cumulative count of Article Views (full-text article views including HTML views, PDF and ePub downloads, according to the available data) and Abstracts Views on Vision4Press platform.
Data correspond to usage on the plateform after 2015. The current usage metrics is available 48-96 hours after online publication and is updated daily on week days.
Initial download of the metrics may take a while.