Fig. 10
Download original image
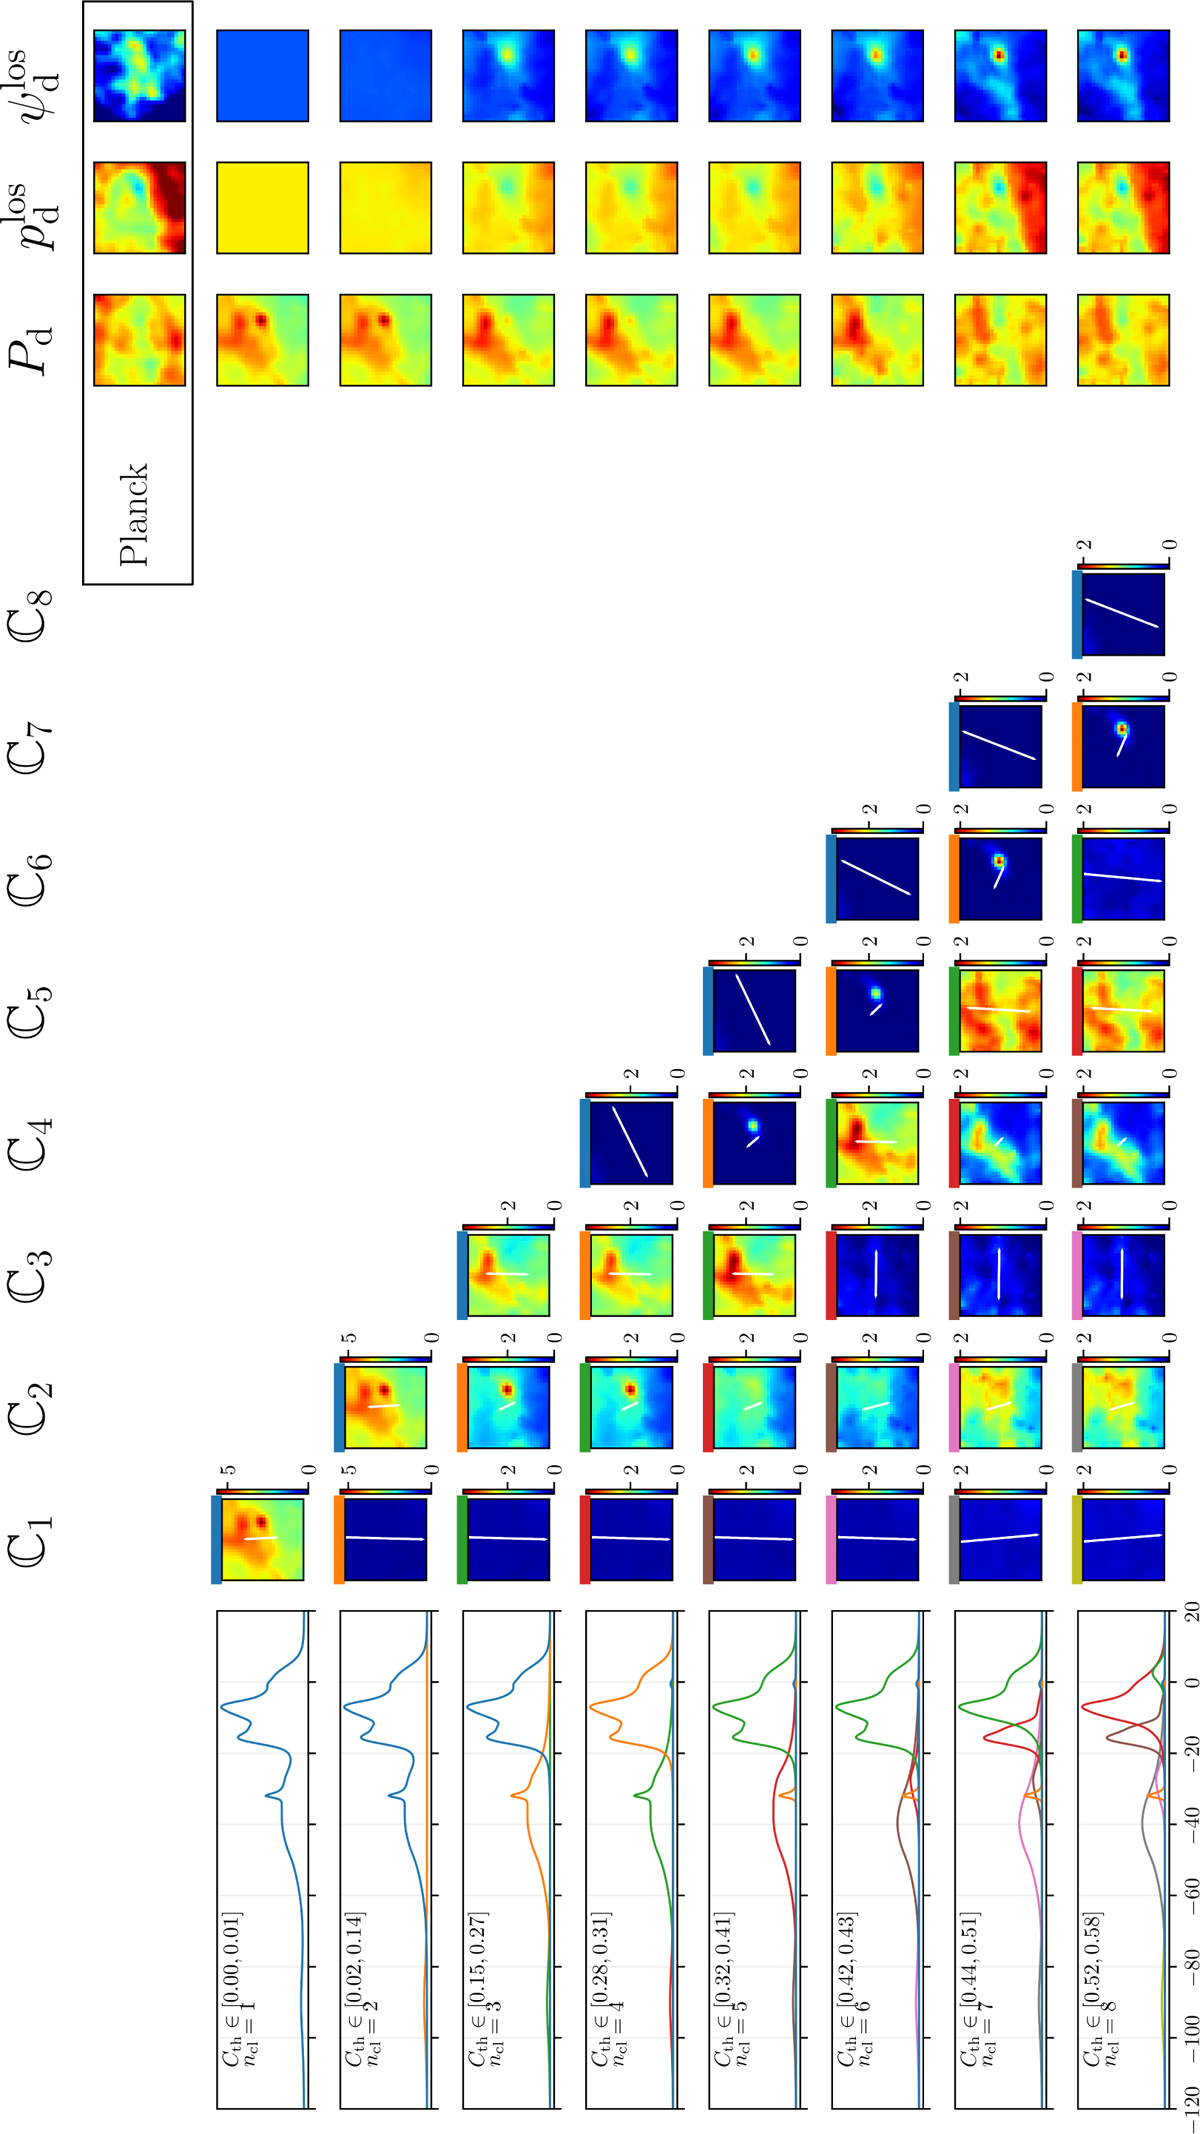
Results obtained for the eight cloud configurations described in Table 3. Left: spatially-averaged spectra of the 353 GHz dust intensity of the ncl clouds, ℂi (i = 1, …, ncl), all in the same (arbitrary) units. Center: maps of the 353 GHz dust intensity (in MJy sr−1) of the ncl clouds. The polarization fractions, ![]() , and polarization angles,
, and polarization angles, ![]() , of the clouds are indicated by the length and orientation of the overplotted white headless vectors. To help make the connection between spectra and maps, each map is topped with a thick band having the same color as the associated spectrum. Right: maps of the resulting polarized intensity,
, of the clouds are indicated by the length and orientation of the overplotted white headless vectors. To help make the connection between spectra and maps, each map is topped with a thick band having the same color as the associated spectrum. Right: maps of the resulting polarized intensity, ![]() , LoS-averaged polarization fraction,
, LoS-averaged polarization fraction, ![]() , and LoS-averaged polarization angle,
, and LoS-averaged polarization angle, ![]() , all in the same units as in Fig. 9. For reference, the corresponding observational Planck maps are shown in the top row.
, all in the same units as in Fig. 9. For reference, the corresponding observational Planck maps are shown in the top row.
Current usage metrics show cumulative count of Article Views (full-text article views including HTML views, PDF and ePub downloads, according to the available data) and Abstracts Views on Vision4Press platform.
Data correspond to usage on the plateform after 2015. The current usage metrics is available 48-96 hours after online publication and is updated daily on week days.
Initial download of the metrics may take a while.