Fig. 2
Download original image
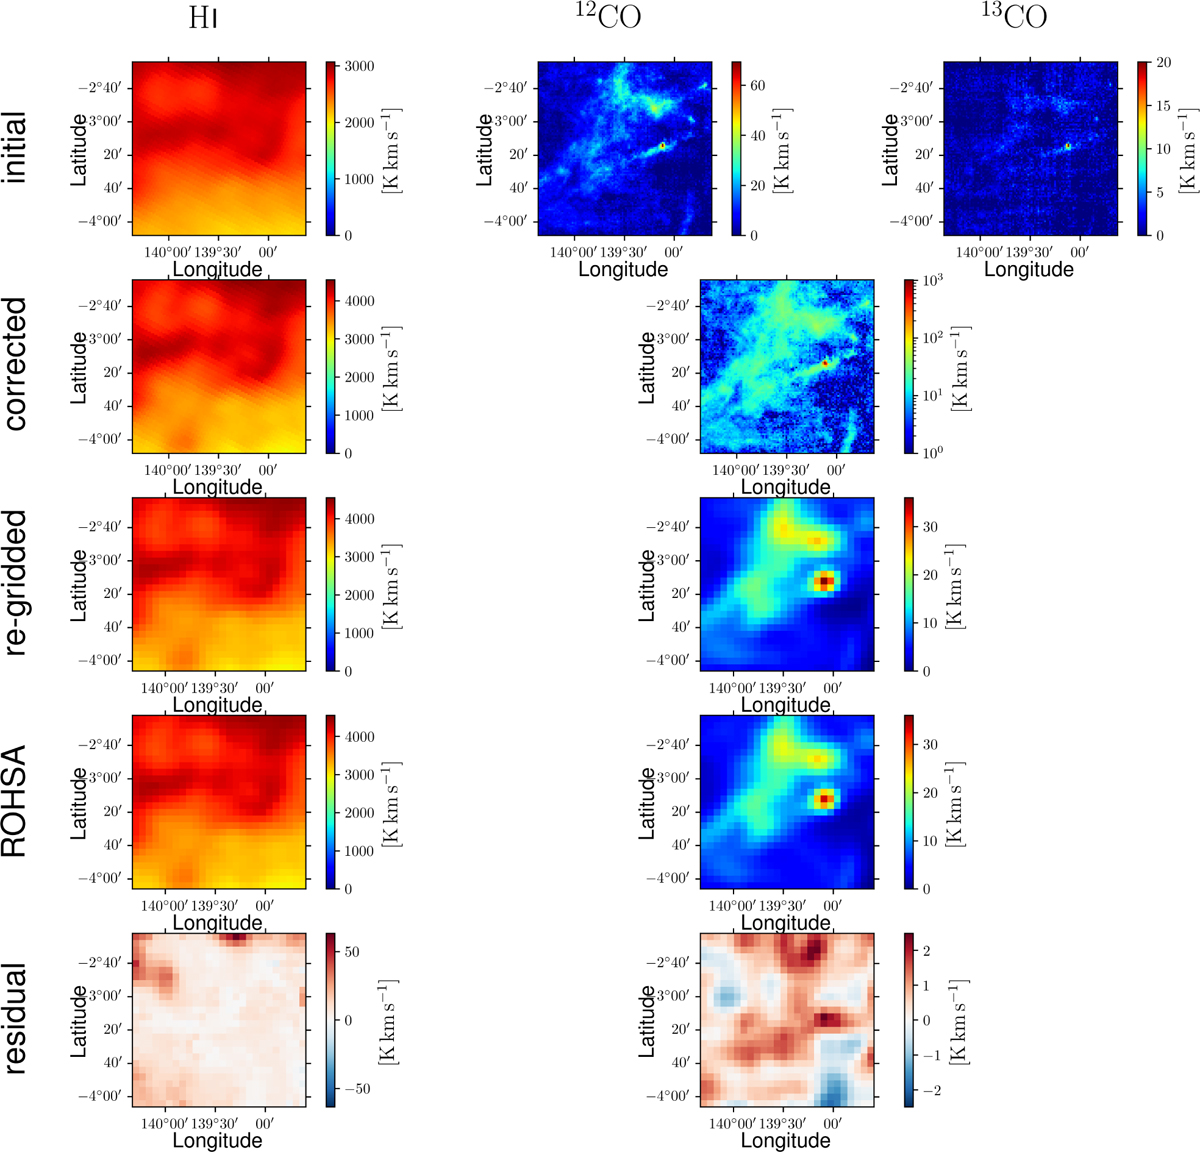
Top row: observational maps of the velocity-integrated brightness temperatures, Tb, of the Hi 21 cm (left), 12CO 2.6 mm (middle), and 13CO 2.7 mm (right) emission lines toward the G139 region; these maps are from Winkel et al. (2016), Yuan et al. (2021), and Yuan et al. (2022), respectively. Second row: maps of the velocity-integrated opacity-corrected brightness temperatures, Tb⋆, of the Hi (left) and 12CO (right) lines, where ![]() is derived based on the combined 12CO and 13CO data. Third row: same maps resampled to the common 26×26 pixel grid (pixel size = 4’). Fourth row: reconstructed maps after application of the Gaussian decomposition algorithm ROHSA. Bottom row: maps of the residuals obtained by subtracting the reconstructed ROHSA maps from the resampled input maps. The color bars for Hi and CO (superscript 12 dropped) can be rescaled to dust intensity at 353 GHz using the best-fit values of the conversion factors derived in Sect. 3.2 (see Fig. 3). The resulting ranges in the third and fourth rows are ≃[0, 3.5 MJy sr−1] for Hi and ≃[0, 2.5 MJy sr−1] for CO.
is derived based on the combined 12CO and 13CO data. Third row: same maps resampled to the common 26×26 pixel grid (pixel size = 4’). Fourth row: reconstructed maps after application of the Gaussian decomposition algorithm ROHSA. Bottom row: maps of the residuals obtained by subtracting the reconstructed ROHSA maps from the resampled input maps. The color bars for Hi and CO (superscript 12 dropped) can be rescaled to dust intensity at 353 GHz using the best-fit values of the conversion factors derived in Sect. 3.2 (see Fig. 3). The resulting ranges in the third and fourth rows are ≃[0, 3.5 MJy sr−1] for Hi and ≃[0, 2.5 MJy sr−1] for CO.
Current usage metrics show cumulative count of Article Views (full-text article views including HTML views, PDF and ePub downloads, according to the available data) and Abstracts Views on Vision4Press platform.
Data correspond to usage on the plateform after 2015. The current usage metrics is available 48-96 hours after online publication and is updated daily on week days.
Initial download of the metrics may take a while.