Fig. 4
Download original image
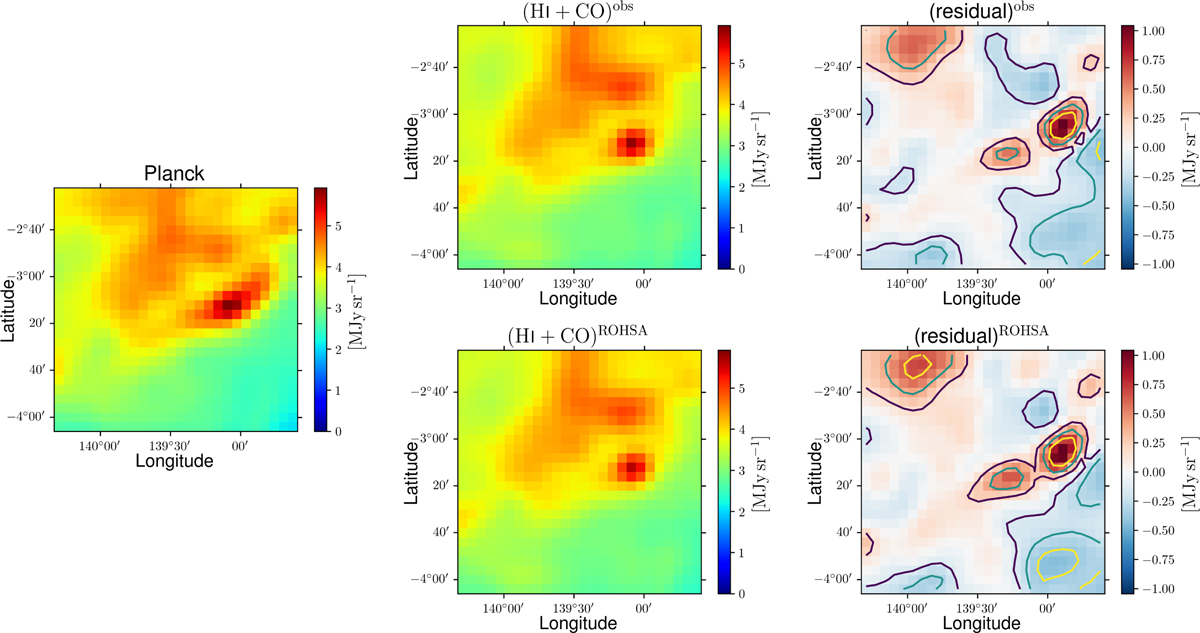
Maps of the intensity, Id, of the dust emission at 353 GHz toward the G139 region. Left: observational map from Planck. Middle: best-fit maps reconstructed with the two gas tracers, Hi and CO, before (top) and after (bottom) application of the Gaussian decomposition algorithm ROHSA to each gas tracer. Right: maps of the residuals obtained by subtracting the respective reconstructed maps from the observational Planck map. The color code refers to the absolute residuals, whereas the contour lines follow the relative residuals.
Current usage metrics show cumulative count of Article Views (full-text article views including HTML views, PDF and ePub downloads, according to the available data) and Abstracts Views on Vision4Press platform.
Data correspond to usage on the plateform after 2015. The current usage metrics is available 48-96 hours after online publication and is updated daily on week days.
Initial download of the metrics may take a while.