Fig. 5
Download original image
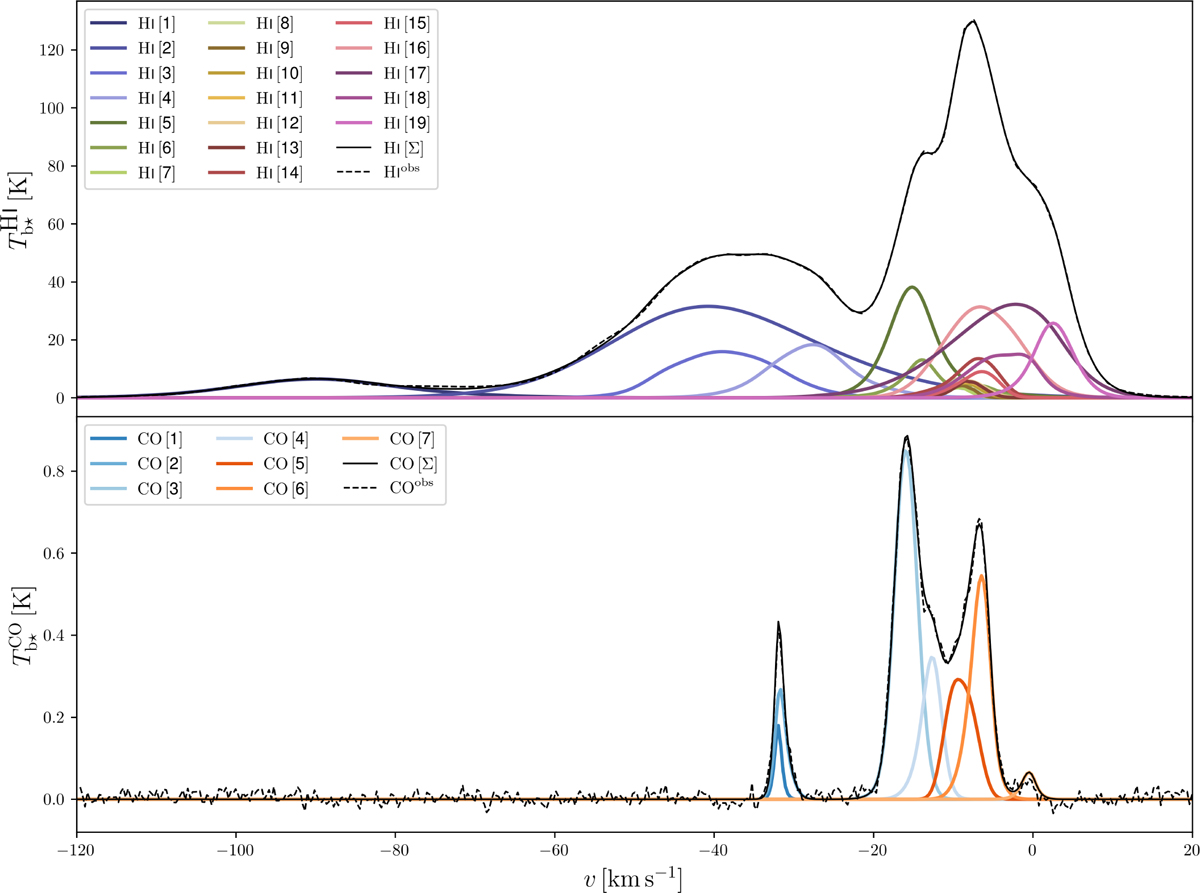
Spectra of the opacity-corrected brightness temperatures, ![]() and
and ![]() , averaged over the 26×26 pixels of the common (l, b) grid, toward the G139 region. The observed spectra are plotted in black dashed line, the reconstructed spectra obtained after application of the Gaussian decomposition algorithm ROHSA are plotted in black solid line, and the spectra of the individual Gaussian kinematic components, which are ordered (for each tracer) by increasing mean velocity, are plotted in color. The
, averaged over the 26×26 pixels of the common (l, b) grid, toward the G139 region. The observed spectra are plotted in black dashed line, the reconstructed spectra obtained after application of the Gaussian decomposition algorithm ROHSA are plotted in black solid line, and the spectra of the individual Gaussian kinematic components, which are ordered (for each tracer) by increasing mean velocity, are plotted in color. The ![]() and
and ![]() spectra can be rescaled to dust intensity per unit velocity at 353 GHz using the best-fit values of the conversion factors derived in Sect. 3.2 (see Fig. 3).
spectra can be rescaled to dust intensity per unit velocity at 353 GHz using the best-fit values of the conversion factors derived in Sect. 3.2 (see Fig. 3).
Current usage metrics show cumulative count of Article Views (full-text article views including HTML views, PDF and ePub downloads, according to the available data) and Abstracts Views on Vision4Press platform.
Data correspond to usage on the plateform after 2015. The current usage metrics is available 48-96 hours after online publication and is updated daily on week days.
Initial download of the metrics may take a while.