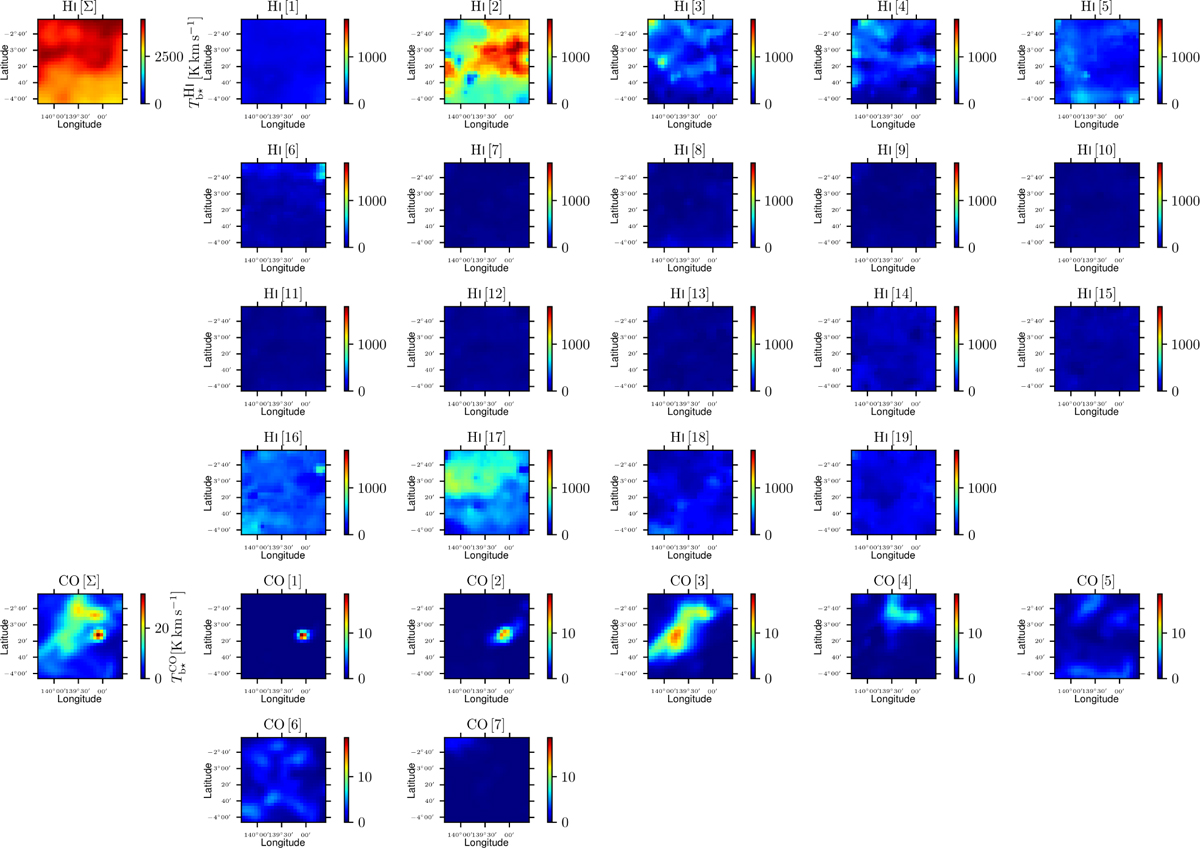
Fig. 6
Download original image
Reconstructed maps of the opacity-corrected brightness temperatures, ![]() (top) and
(top) and ![]() (bottom), integrated over velocity, toward the G139 region, after application of the Gaussian decomposition algorithm ROHSA (leftmost column), together with the contributions from the individual Gaussian kinematic components (columns 2–6). The maps can be rescaled to dust intensity at 353 GHz using the best-fit values of the conversion factors derived in Sect. 3.2 (see Fig. 3).
(bottom), integrated over velocity, toward the G139 region, after application of the Gaussian decomposition algorithm ROHSA (leftmost column), together with the contributions from the individual Gaussian kinematic components (columns 2–6). The maps can be rescaled to dust intensity at 353 GHz using the best-fit values of the conversion factors derived in Sect. 3.2 (see Fig. 3).
Current usage metrics show cumulative count of Article Views (full-text article views including HTML views, PDF and ePub downloads, according to the available data) and Abstracts Views on Vision4Press platform.
Data correspond to usage on the plateform after 2015. The current usage metrics is available 48-96 hours after online publication and is updated daily on week days.
Initial download of the metrics may take a while.