Fig. 7
Download original image
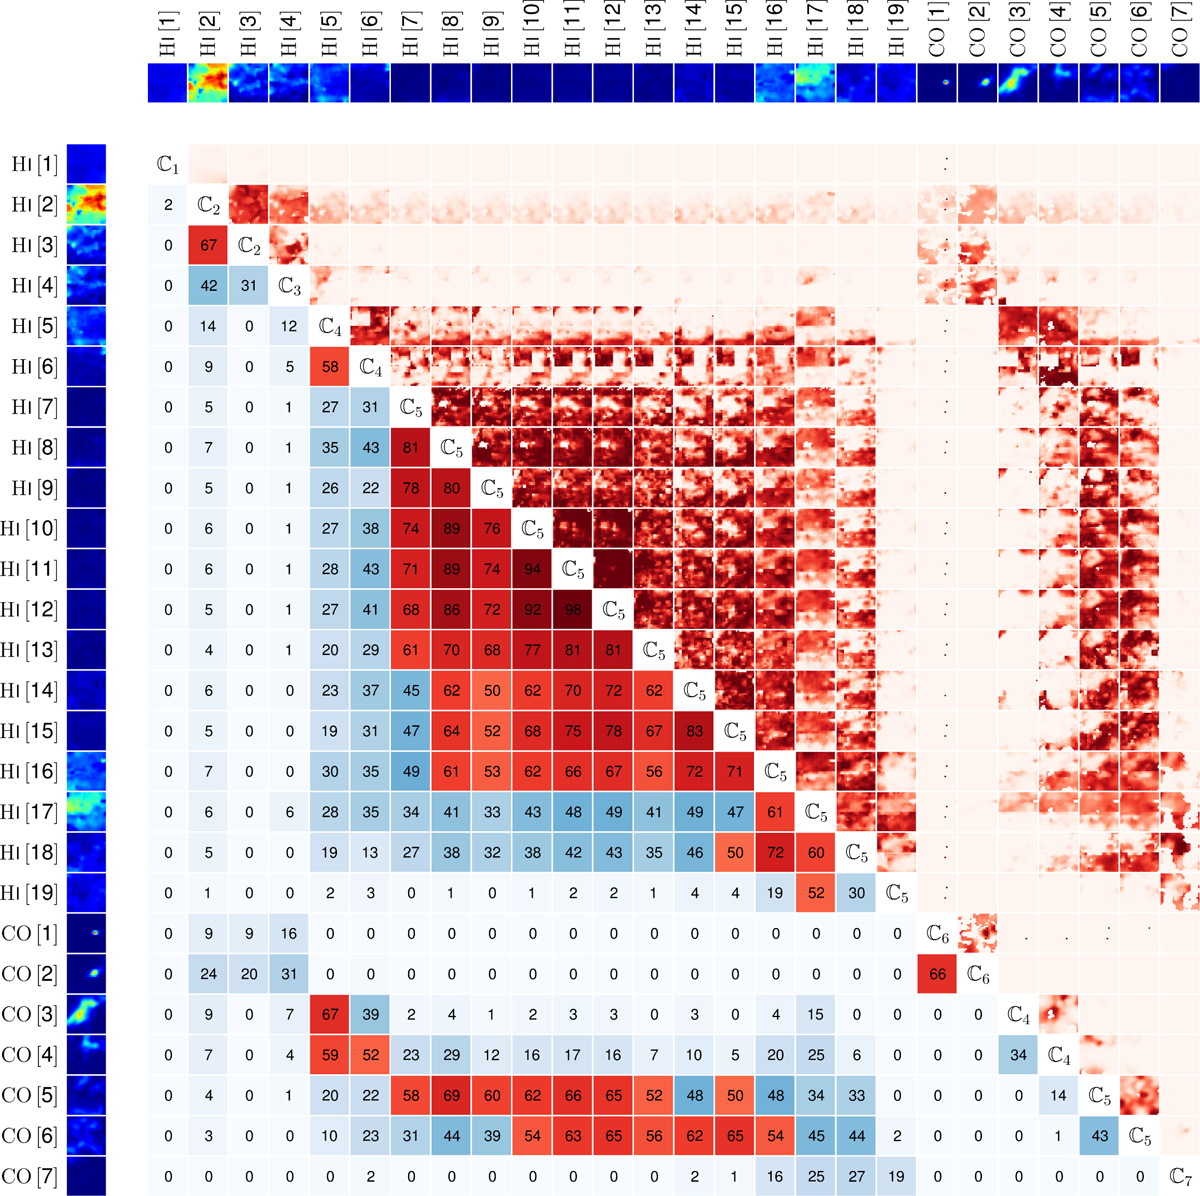
Correlation coefficient, 𝒞jj′ (Eq. (29)), expressed in percent, for the 325 possible pairs of Gaussian kinematic components j and j′ (j ≠ j′) extracted with ROHSA in the Hi and CO spectral cubes of the G139 region. The names of the 26 components, together with the mini-maps of their dust intensities, are shown along the top row and left column. Mini-maps of 𝒞jj′ are displayed in the upper-right half of the figure. The weighted average values of 𝒞jj′ over the 26 × 26 pixels, ⟨𝒞jj′ ⟩ (Eq. (30)), are indicated in the lower-left half, with red or light-blue shading according to whether ⟨𝒞jj′ ⟩ ≥ 50% or ⟨𝒞jj′ ⟩ < 50% and with a level of shading increasing with increasing ⟨𝒞jj′⟩. Pairs for which ⟨𝒞jj′⟩ ≥ 50% have their two components j and j′ combined and assigned to a same cloud. The 26 components are thus grouped into seven different clouds, ℂ1, …, ℂ 7, as indicated along the diagonal.
Current usage metrics show cumulative count of Article Views (full-text article views including HTML views, PDF and ePub downloads, according to the available data) and Abstracts Views on Vision4Press platform.
Data correspond to usage on the plateform after 2015. The current usage metrics is available 48-96 hours after online publication and is updated daily on week days.
Initial download of the metrics may take a while.