Fig. 8
Download original image
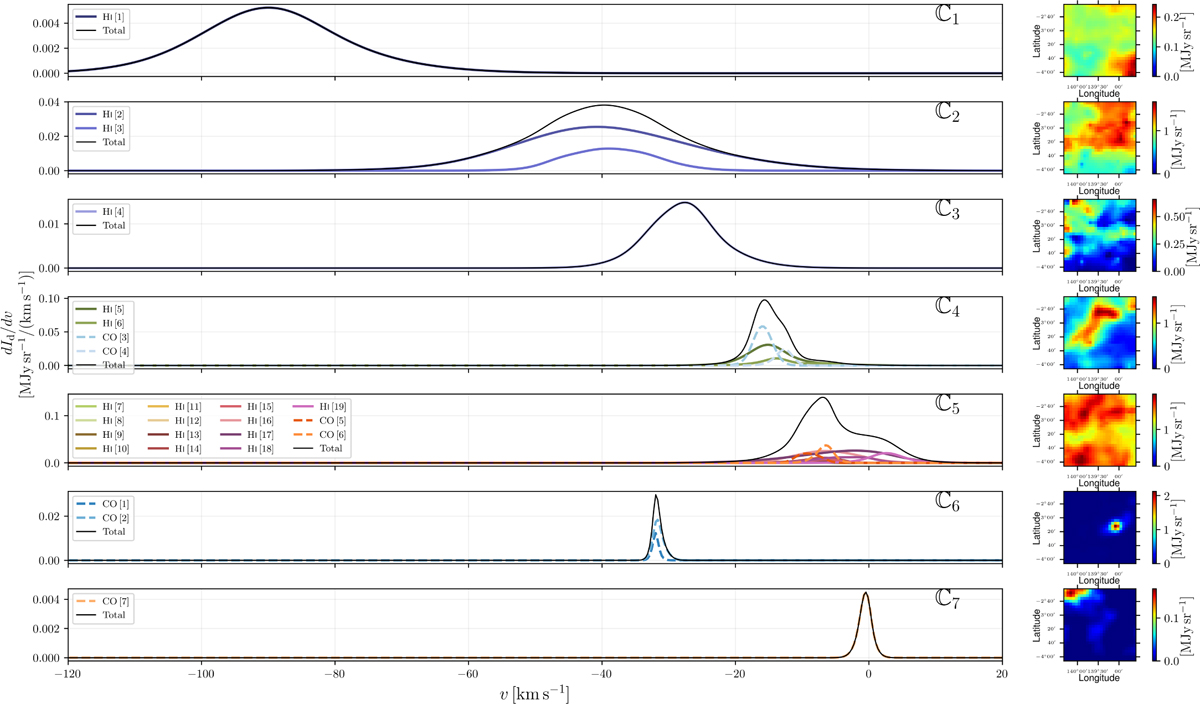
Reconstructed spectra (left) and maps (right) of the 353 GHz dust intensities, Id,i, of the seven clouds, ℂi (i = 1, …, 7), identified in the G139 region. The spectra are averaged over the 26 × 26 pixels of the (l, b) grid. The total spectra are plotted in black solid line, while the spectra of the individual kinematic components are plotted in color, using the same colors as in Fig. 5 and two different linestyles to distinguish the two gas tracers (solid for Hi and dashed for CO).
Current usage metrics show cumulative count of Article Views (full-text article views including HTML views, PDF and ePub downloads, according to the available data) and Abstracts Views on Vision4Press platform.
Data correspond to usage on the plateform after 2015. The current usage metrics is available 48-96 hours after online publication and is updated daily on week days.
Initial download of the metrics may take a while.