Open Access
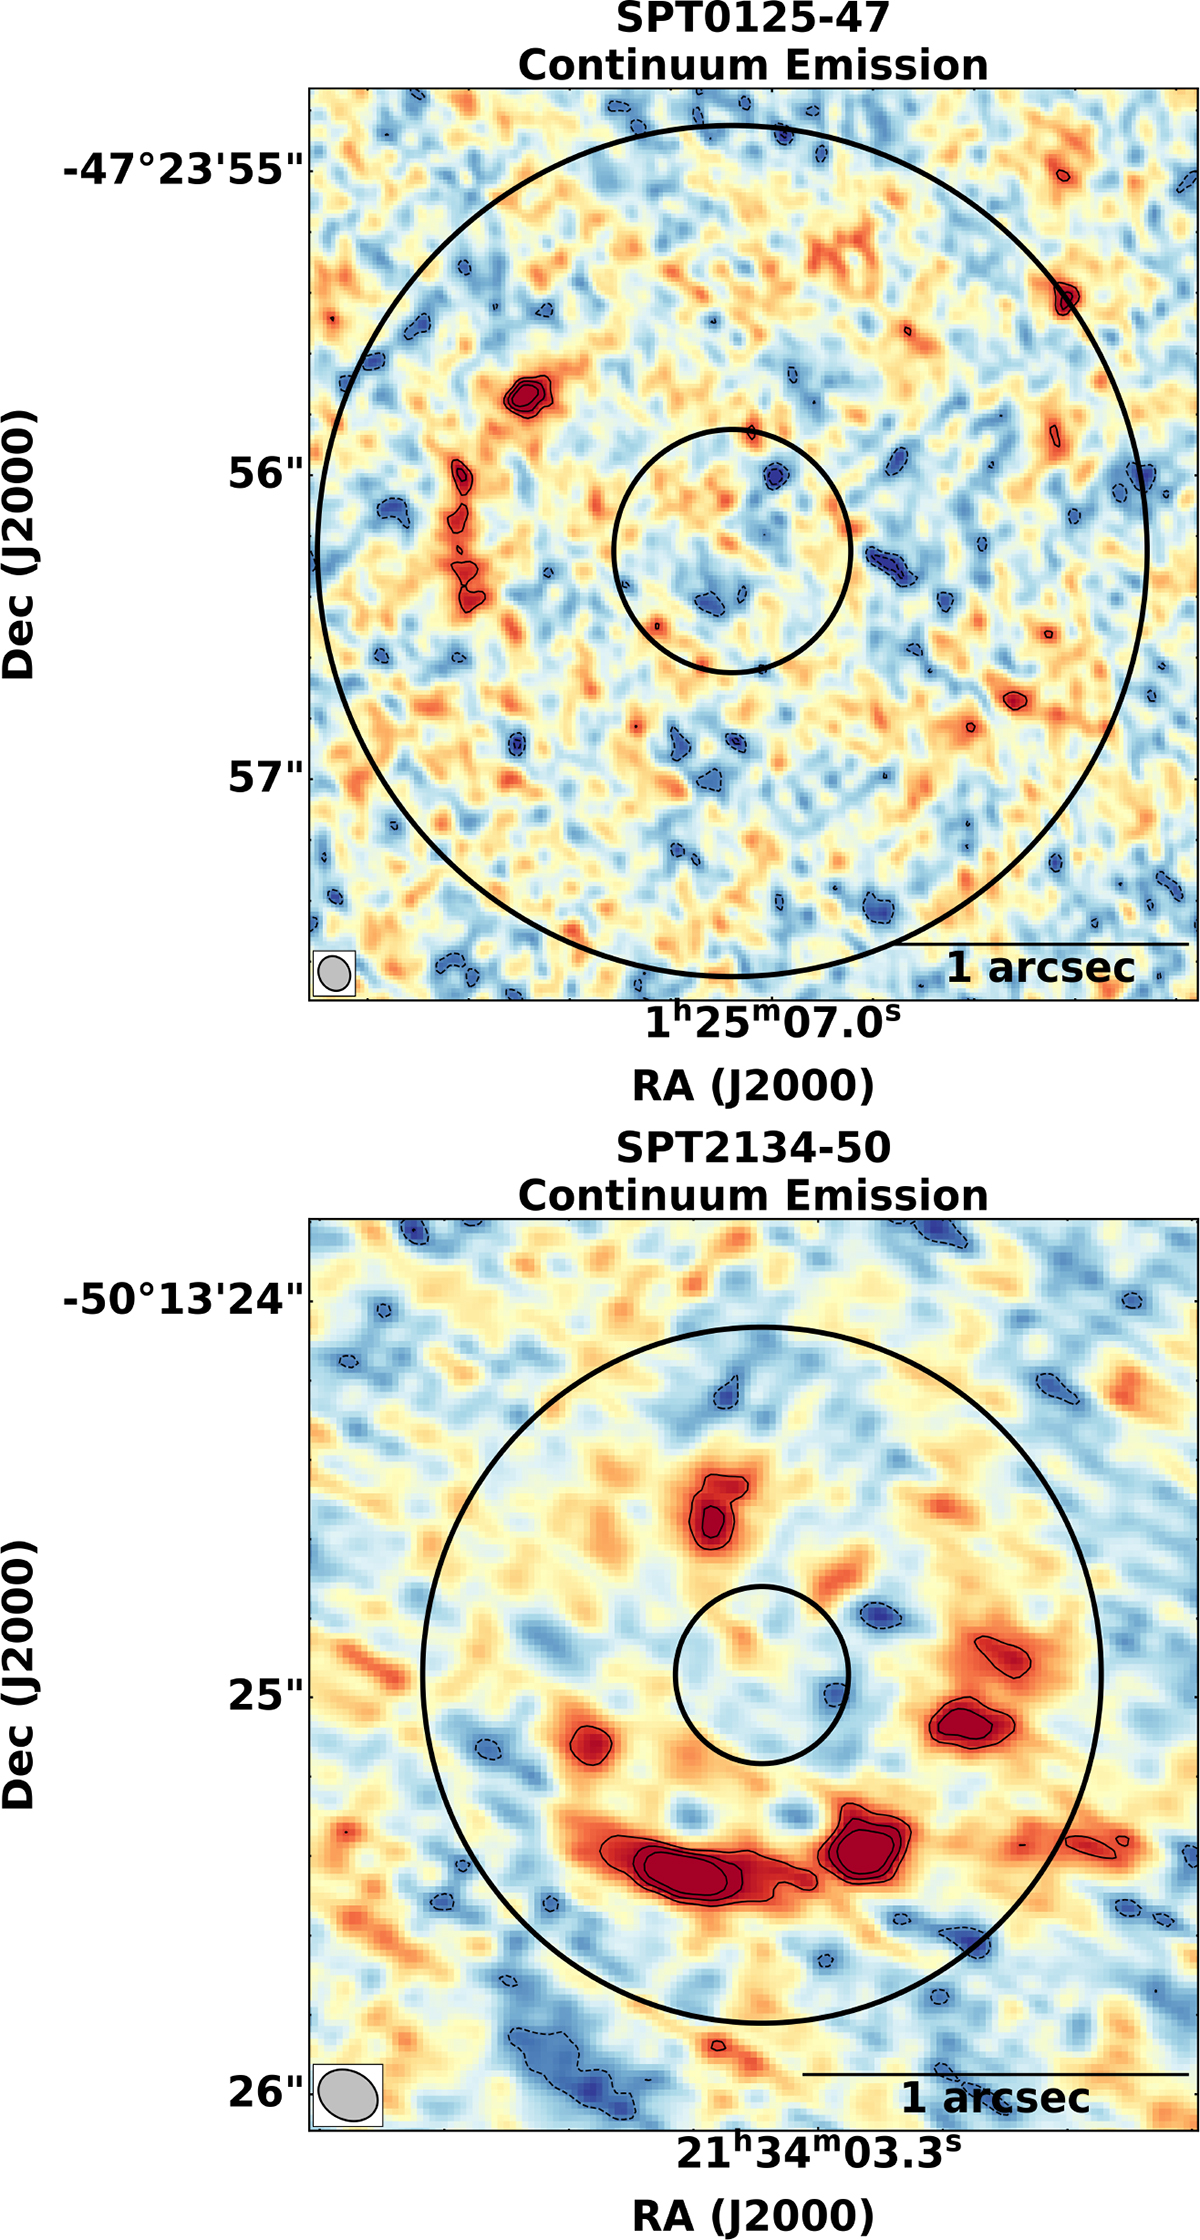
Fig. 1.
Download original image
Continuum image of SPT 0125-47 (top) and SPT 2134-50 (bottom). The contours are shown at −3, −2, 3, 4, 5σ levels. The synthesized beam is shown in the bottom left of each image. The black annulus shows the regions used to extract the dust continuum emission.
Current usage metrics show cumulative count of Article Views (full-text article views including HTML views, PDF and ePub downloads, according to the available data) and Abstracts Views on Vision4Press platform.
Data correspond to usage on the plateform after 2015. The current usage metrics is available 48-96 hours after online publication and is updated daily on week days.
Initial download of the metrics may take a while.