Fig. 2.
Download original image
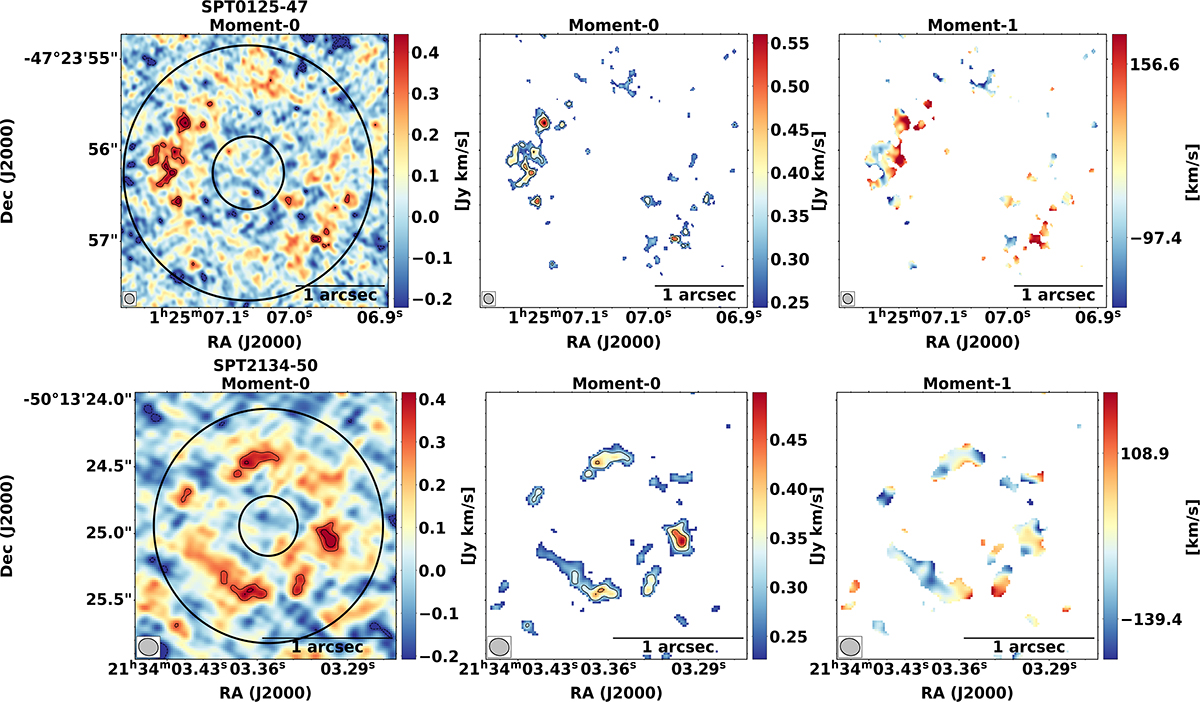
Moment-0 and moment-1 maps of the CO(3–2) emission for SPT 0125-47 (top) and SPT 2134-50 (bottom). The first column shows the unmasked moment-0 map, the second column shows the moment-0 map masked to show only values above 3σ, and the third column shows the moment-1 map. The contours in the first two columns are shown at −3, −2, 3, 4, 5, 6, 7, 8, 9, 10σ levels. The synthesized beam is shown in the bottom left of each image. The black annulus in the unmasked moment-0 map for each source shows where the spectrum was extracted from.
Current usage metrics show cumulative count of Article Views (full-text article views including HTML views, PDF and ePub downloads, according to the available data) and Abstracts Views on Vision4Press platform.
Data correspond to usage on the plateform after 2015. The current usage metrics is available 48-96 hours after online publication and is updated daily on week days.
Initial download of the metrics may take a while.