Fig. 4.
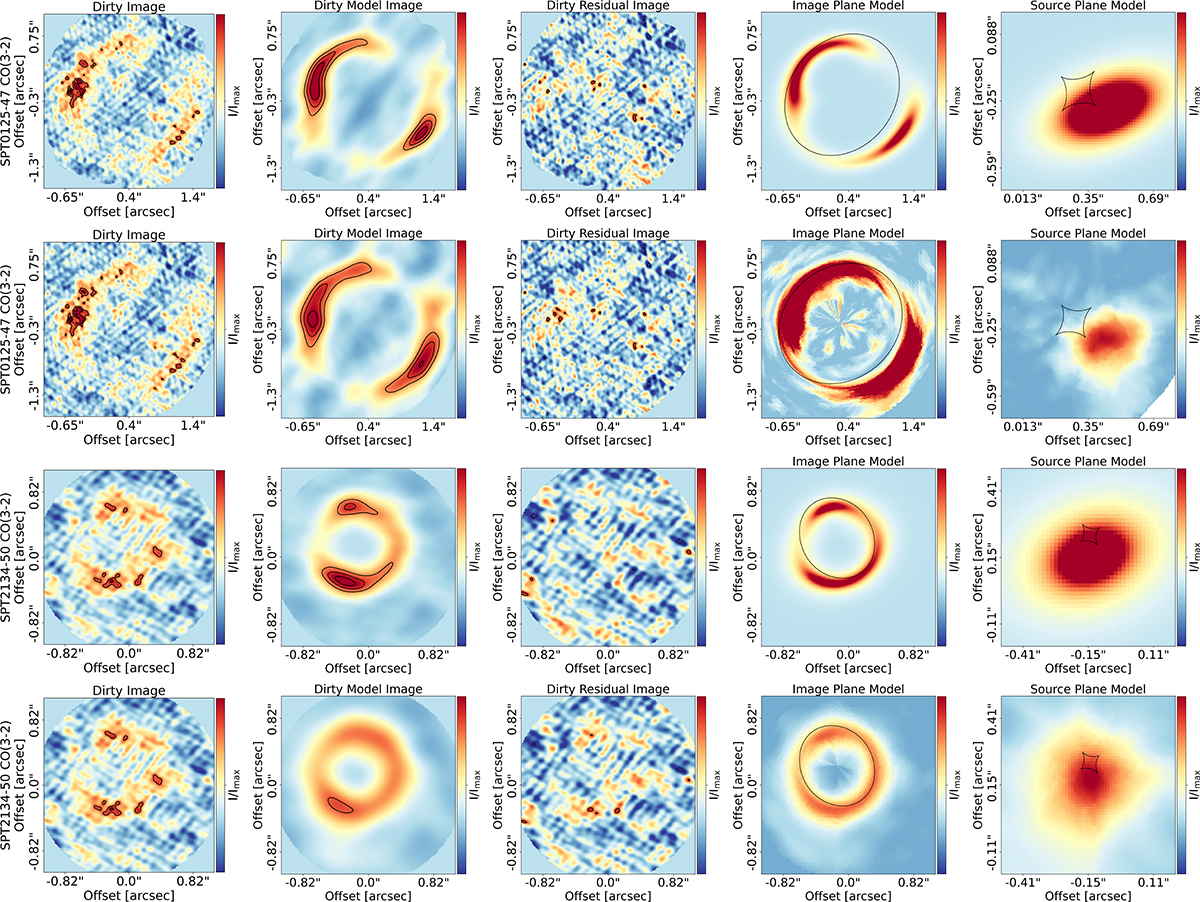
Download original image
Parametric (rows 1 and 3) and pixelized (rows 2 and 4) lens modeling of the CO(3–2) emission detected in SPT 0125-47 (top two rows) and SPT 2134-50 (bottom two rows). The first column displays the dirty image generated by PYAUTOLENS, with contours at −3, 3, 4, 5, 6, 7, 8, 9, 10σ levels. Note: this is not a cleaned image, so structures may differ slightly from those in cleaned images. The second column presents the dirty model image from PYAUTOLENS, also with contours at −3, 3, 4, 5, 6, 7, 8, 9, 10σ levels. The third column shows the dirty residual image produced by PYAUTOLENS, with contours at −3, 3, 4, 5σ levels. The fourth column illustrates the image plane emission parametric/pixelized model of the data, produced by PYAUTOLENS, with the black line representing the critical line. The fifth column shows the source plane emission parametric+pixelized model of the data from PYAUTOLENS, with the black line indicating the caustic line. All images are centered around the ALMA phase center.
Current usage metrics show cumulative count of Article Views (full-text article views including HTML views, PDF and ePub downloads, according to the available data) and Abstracts Views on Vision4Press platform.
Data correspond to usage on the plateform after 2015. The current usage metrics is available 48-96 hours after online publication and is updated daily on week days.
Initial download of the metrics may take a while.