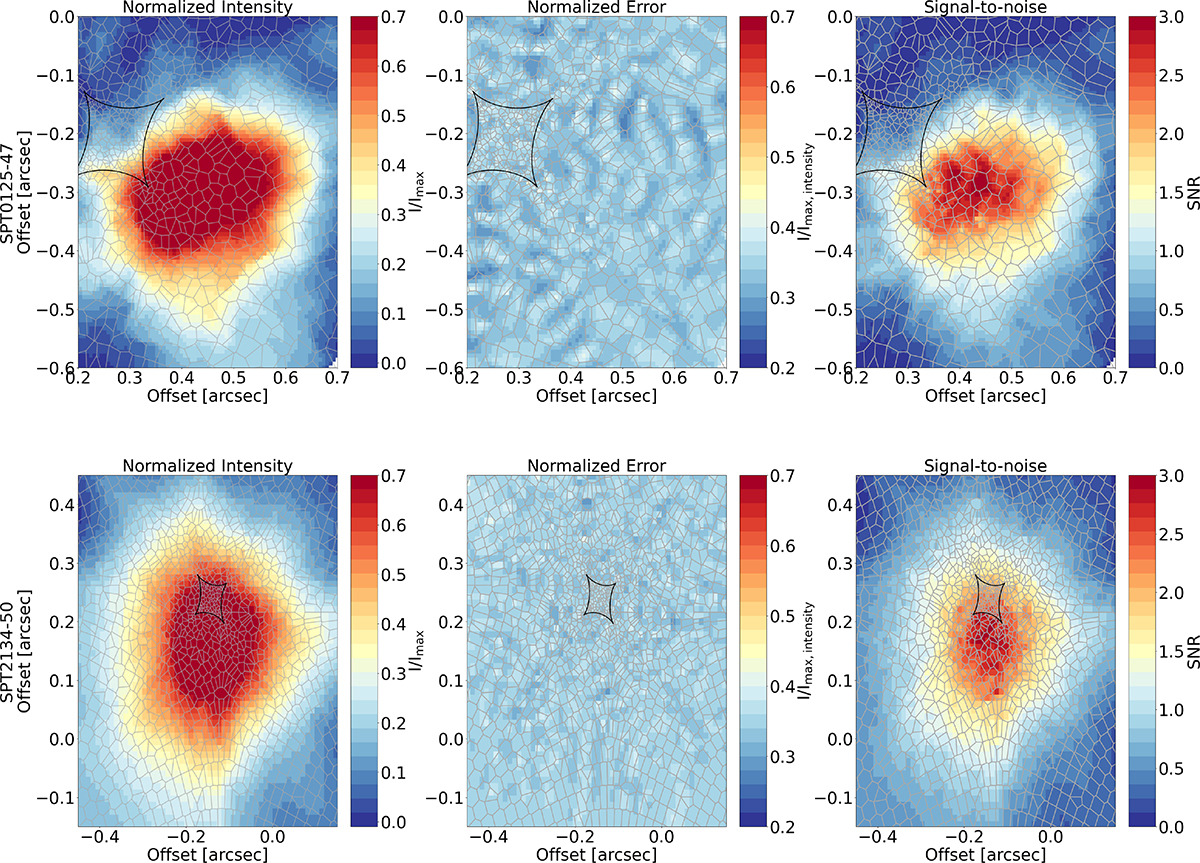
Fig. 5.
Download original image
Source plane intensity (left), intensity error maps (middle), and S/N maps (i.e., intensity divided by intensity error, right) for SPT 0125-47 and SPT 2134-50. The gray polygons show the Voronoi mesh used for the pixelized reconstruction and the black line shows the caustic line. Both the intensity and intensity error maps are normalized, where the error maps have been normalized to the maximum of the intensity map, meaning that the value can be seen as a percentage error per pixel. The S/N map provides a measure of the significance of the reconstructed emission.
Current usage metrics show cumulative count of Article Views (full-text article views including HTML views, PDF and ePub downloads, according to the available data) and Abstracts Views on Vision4Press platform.
Data correspond to usage on the plateform after 2015. The current usage metrics is available 48-96 hours after online publication and is updated daily on week days.
Initial download of the metrics may take a while.