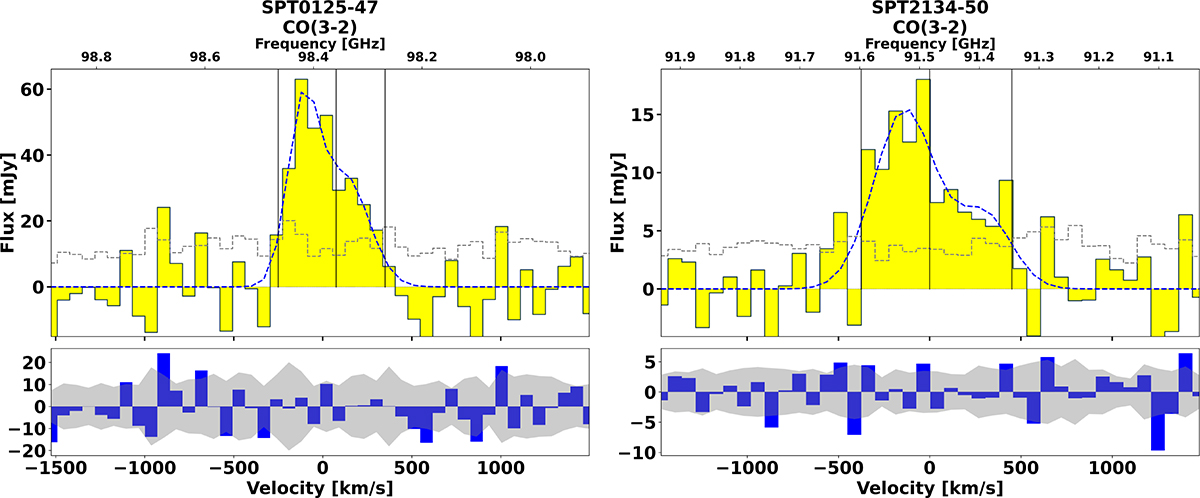
Fig. B.1.
Download original image
Spectra of the CO(3–2) toward SPT 0125-47 (left) and SPT 2134-50 (right) showing the coverage of the red and blue bins used to investigate the effect of differential lensing, as described in Section 4.1. In both cases, the spectrum is shown in the top panel, and the residuals from the Gaussian fit are shown in the bottom panel. The dashed blue line shows the two Gaussian fit to the spectra. The dashed gray line in the top panel and the shaded gray region in the lower panel indicate the per-channel RMS. Additionally, the top axis in the top panel of each spectrum displays the corresponding frequency.
Current usage metrics show cumulative count of Article Views (full-text article views including HTML views, PDF and ePub downloads, according to the available data) and Abstracts Views on Vision4Press platform.
Data correspond to usage on the plateform after 2015. The current usage metrics is available 48-96 hours after online publication and is updated daily on week days.
Initial download of the metrics may take a while.