Fig. A.1
Download original image
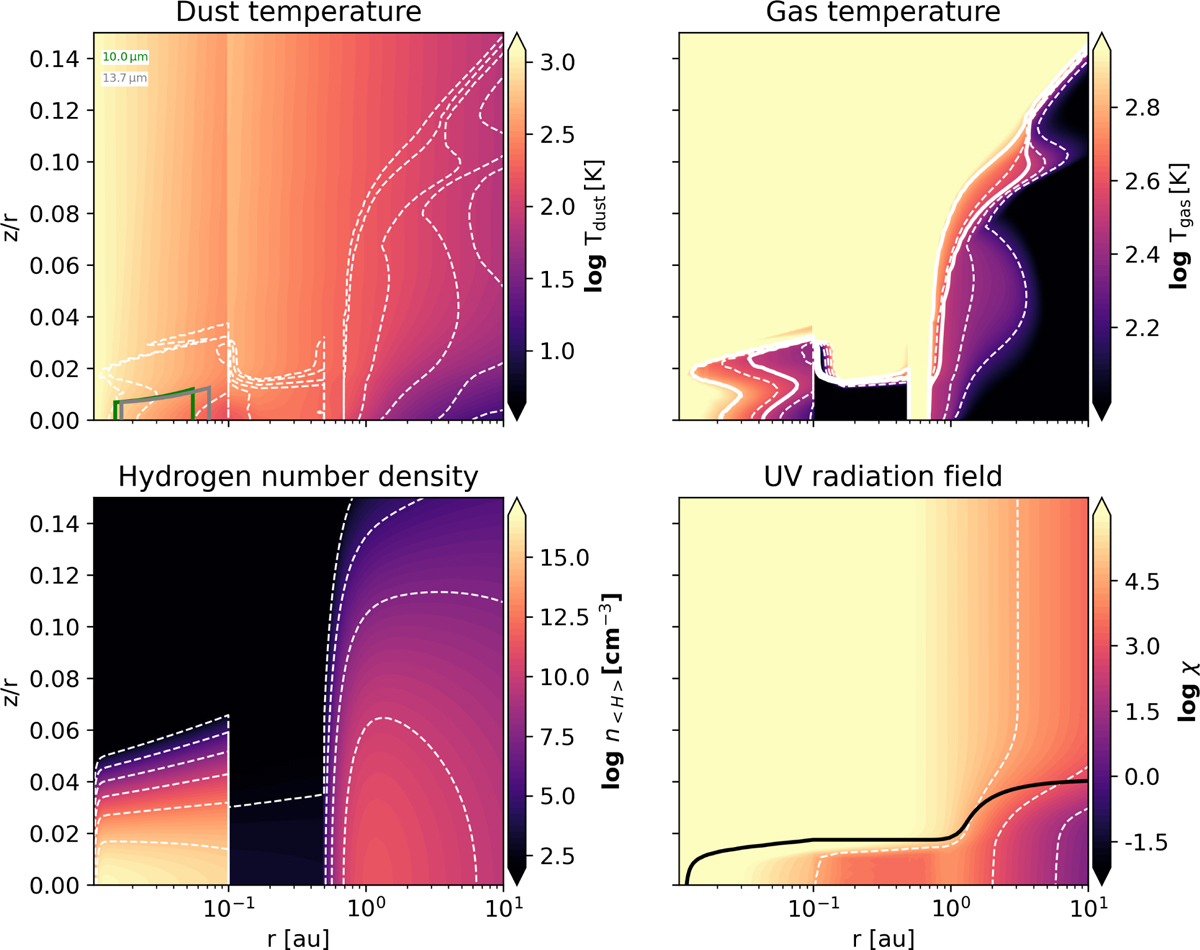
Two-dimensional gas temperature, dust temperature, gas density, and the UV radiation field structure in the best fit model. The white solid contours correspond to the gas temperature of 330 and 650 K. The grey and green contours represent where the dust emission at 13.7 and 10 µm is coming from. The black contour corresponds to the radial Av of 1 mag. The white dashed contours correspond to the value of the ticks on the colour bar.
Current usage metrics show cumulative count of Article Views (full-text article views including HTML views, PDF and ePub downloads, according to the available data) and Abstracts Views on Vision4Press platform.
Data correspond to usage on the plateform after 2015. The current usage metrics is available 48-96 hours after online publication and is updated daily on week days.
Initial download of the metrics may take a while.