| Issue |
A&A
Volume 705, January 2026
|
|
|---|---|---|
| Article Number | A222 | |
| Number of page(s) | 18 | |
| Section | Interstellar and circumstellar matter | |
| DOI | https://doi.org/10.1051/0004-6361/202451844 | |
| Published online | 23 January 2026 | |
MINDS: Strong oxygen depletion in the inner regions of a very low-mass star disk?
1
Kapteyn Astronomical Institute, University of Groningen,
PO Box 800,
9700 AV
Groningen,
The Netherlands
2
Space Research Institute, Austrian Academy of Sciences,
Schmiedlstr. 6,
8042
Graz,
Austria
3
Institute for Theoretical Physics and Computational Physics, Graz University of Technology,
Petersgasse 16,
8010
Graz,
Austria
4
Leiden Observatory, Leiden University,
PO Box 9513,
2300 RA
Leiden,
The Netherlands
5
Max-Planck Institut für Extraterrestrische Physik (MPE),
Giessenbachstr. 1,
85748
Garching,
Germany
6
Max-Planck-Institut für Astronomie (MPIA),
Königstuhl 17,
69117
Heidelberg,
Germany
7
School of Physical Science and Technology, Southwest Jiaotong University,
Chengdu
610031,
China
8
SRON Netherlands Institute for Space Research,
Niels Bohrweg 4,
NL-2333 CA
Leiden,
The Netherlands
9
Dept. of Astrophysics, University of Vienna,
Türkenschanzstr. 17,
1180
Vienna,
Austria
10
ETH Zürich, Institute for Particle Physics and Astrophysics,
Wolfgang-Pauli-Str. 27,
8093
Zürich,
Switzerland
11
LESIA, Observatoire de Paris, Université PSL, CNRS, Sorbonne Université, Univ. Paris Diderot,
Sorbonne Paris Cité, 5 place Jules Janssen,
92195
Meudon,
France
12
Centro de Astrobiología (CAB), CSIC-INTA, ESAC Campus,
Camino Bajo del Castillo s/n,
28692
Villanueva de la Cañada, Madrid,
Spain
13
Université Paris-Saclay, CNRS, Institut d’Astrophysique Spatiale,
91405
Orsay,
France
14
Department of Physics and Astronomy, University of Exeter,
Exeter
EX4 4QL,
UK
15
Current affiliation: Department of Astronomy, University of Michigan,
1085 S. University Ave,
Ann Arbor,
MI
48109,
USA
★ Corresponding author: This email address is being protected from spambots. You need JavaScript enabled to view it.
Received:
9
August
2024
Accepted:
6
August
2025
Abstract
Context. Thanks to JWST, a plethora of species in planet-forming disks around very low mass stars such as C2H2, C6H6, C4H2, CH3 etc. are being discovered. The column densities of these species retrieved from 0D slab models are very large (e.g. of the order of 1020 cm−2). This indicates a carbon-dominated chemistry in a gas with a high C/O ratio. The disk around 2MASS-J1605321-1993159 (M4.5) is one such source showing a molecular pseudo-continuum of C2H2. Notably, two oxygen-bearing molecules, CO and CO2, are also detected in this source.
Aims. We aim to take the next step beyond 0D slab models to interpret the spectrum. We examine whether 2D thermo-chemical disk models can produce the large inferred column densities of C2H2 in the inner regions of the disk and produce a pseudo-continuum in the mid-IR spectrum. We also seek to constrain whether the depletion of oxygen or the enrichment of carbon causes the high C/O ratio triggering a carbon-dominated chemistry.
Methods. We utilised the radiative thermo-chemical disk model PRODIMO to identify a disk structure that is capable of producing the observed molecular emission of species such as CO, CO2, C2H2, and H2O simultaneously. The spectrum was generated using the fast line tracer FLiTs. We derived the gas temperature ⟨T⟩, column density ⟨log10N⟩, and the emitting area ⟨r1 − r2⟩ for these molecules from the 2D disk model and compared them to the parameters retrieved originally from 0D slab models. We used the different effect that changing the O or C abundance has on CO and C2H2, respectively to discriminate between O depletion and C enhancement.
Results. We find that a disk structure characterised by the presence of a gap can best explain the observations. The inner disk is strongly depleted in dust, especially small grains (<5 µm), and elemental oxygen, leading to a large C/O ratio. This is required to produce a molecular pseudo-continuum of C2H2 and at the same time a relatively weak CO emission. The P- and R-branch of C2H2 probe deeper layers of the disk whereas the Q-branch probes mostly the surface layers. The combined emission of CO and CO2 puts strong constraints on the gap’s location (0.1–0.5 au) given a disk gas mass. We also report a new detection of the CO ν= 2→1 transition in the JWST spectrum.
Conclusions. Two-dimensional thermo-chemical disk models are able to produce the observed molecular pseudo-continuum of C2H2. We find that the combination of different species emission in the JWST spectra can be used to discriminate between different scenarios such as O-depletion, C-enhancement or both, and offers the potential to extract spatial substructure at scales smaller than ∼1 au.
Key words: astrochemistry / radiative transfer / methods: numerical / protoplanetary disks / brown dwarfs / infrared: planetary systems
© The Authors 2026
 Open Access article, published by EDP Sciences, under the terms of the Creative Commons Attribution License (https://creativecommons.org/licenses/by/4.0), which permits unrestricted use, distribution, and reproduction in any medium, provided the original work is properly cited.
This article is published in open access under the Subscribe to Open model. This email address is being protected from spambots. You need JavaScript enabled to view it. to support open access publication.
1 Introduction
Our Galaxy harbors a significant number (∼20%) of very low mass stars (VLMSs) (Liebert & Probst 1987, <0.3 M⊙) (Kirkpatrick et al. 2012). They are known to have high occurrence rates of terrestrial planets (Sabotta et al. 2021; Schlecker et al. 2022). The disks around VLMSs are faint and, hence, difficult to observe. Notably, Pascucci et al. (2009, 2013) observed the gas in the inner regions of these faint sources with the Spitzer Space Telescope and detected molecules such as C2H2 and HCN. These inner regions are warm (200–1000 K) and dense (108–1015 cm−3) and are the sites for planet formation (Henning & Semenov 2013; Walsh et al. 2015; Ormel et al. 2017). With the advent of the James Webb Space Telescope (JWST), unprecedented insight into these regions has been gained due to its higher spectral resolution and sensitivity, albeit without spatial resolution. For instance, 2MASS-J1605321-1993159 (hereafter J160532, Tabone et al. 2023), ISO-Chal 147 (Arabhavi et al. 2024), Sz28 (Kanwar et al. 2024a), Cha Hα 1 (Morales-Calderón et al. 2025), and J043814 (Perotti et al. 2025) are all disks around VLMSs that have now been observed with JWST/MIRI-MRS (Rieke et al. 2015; Wells et al. 2015; Wright et al. 2015, 2023; Rigby et al. 2023; Labiano et al. 2021) as a part of MIRI mid-Infrared Disk Survey (MINDS) program (Henning et al. 2024; Kamp et al. 2023). Arabhavi et al. (2025a) have reported detection of various hydrocarbons in many VLMS disks in the MINDS sample. Sz114 (Xie et al. 2023) is another disk around an M5 star observed with JWST. While Sz114 and J043814 have both been detected with the Atacama Large Mil-limeter/Submillimeter Array (ALMA), J160532, ISO-Cha1 147, and Sz28 have not been detected with ALMA in the continuum (Barenfeld et al. 2016), indicating that these disks have a very low dust mass. The disks around J160532, ISO-Cha1 147, and Sz28 show emission from a variety of hydrocarbons at mid-infrared wavelengths, indicating a high C/O ratio in their inner regions. However, whether this is due to the depletion of oxygen or the enrichment of carbon is yet to be determined. Investigating the gas composition within these inner disks can help to determine the initial ingredients for planet formation.
The disk around the M4.5 star J160532 (M⋆=0.16 M⊙, Pascucci et al. 2013) is one such source with a high C/O elemental ratio in the gas. It is a member of β Sco (7.6 Myr, Ratzenböck et al. 2023) in the Upper Scorpius star-forming region which is 3-20 Myr old (Ratzenböck et al. 2023) and at a distance of 152 pc (Gaia Collaboration 2023). J160532 is accreting with a rate between 10−10 and 10−9 M⊙ yr−1, consistent with the strength of molecular hydrogen lines in the spectrum (Rigliaco et al. 2015; Franceschi et al. 2024). Its estimated UV luminosity [log(LFUV)] is –3.59 L⊙, and it has only an upper limit on X-rays [log(LX)] of 28.8 ergs s−1. The disk does not show any 10 µm silicate feature in Spitzer nor in JWST-MIRI observations, indicating that either the grains are large or that dust is largely absent from the inner warm disk. The peculiar shape of the spectral energy distribution (SED) between 5 and 20 µm has been explained by Tabone et al. (2023) with a molecular pseudo-continuum of C2H2. They used LTE 0D slab models to identify and analyse the emission in the JWST-MIRI/MRS spectrum of J160532 and found the pseudo-continuum to be caused by optically thick emission of C2H2 with column densities of ∼1020 cm−2 and temperatures of ∼500 K. In addition, they required an optically thin colder component of C2H2 (400 K), producing the prominent Q-branch. Tabone et al. (2023) attributed such high column densities of C2H2 to the lack of grains in the inner disk, thus probing very deep into layers close to the midplane. Tabone et al. (2023) explained these detections by invoking a gap that stops the flow of icy grains into the inner disk and results in depletion of oxygen in the inner disk. This spectrum also shows the first detections of C6H6 and C4H2 in the inner regions of a planet-forming disk and the emission from the oxygen-bearing species CO (ν= 1→0) and CO2 (bending mode at 14.98 µm). Arabhavi et al. (2025b) reported weak detection of ro-vibrational water in this source.
The slab models provide valuable first estimates of the emitting conditions of the various molecules. However, such models do not account for dust opacity, chemistry or a self-consistent gas temperature given the emitting region around the star. The thermal structure, radiative transfer and the chemistry are intertwined. Two-dimensional thermo-chemical disk models possess a high degree of consistency in their physical and chemical structures. This implies that changing a parameter to increase the emission from one molecule also affects the emission from other molecules. This can be due to various reasons. For example, the chemistry could be connected, the thermal balance of the gas could be affected, or the dust optical depth changes, thus also changing how deep the disk layers can be probed. So, contrary to individual 0D slab models, we can no longer tweak a single molecule at a time. Earlier studies such as Walsh et al. (2015), Greenwood et al. (2017) and Kanwar et al. (2024a) modelled the disks around VLMS with 2D thermo-chemical models and noted the key chemical pathways leading to the formation of hydrocarbons as well as the relevance of dust evolution for the strength of the mid-IR line emission.
The aim of this paper is to investigate whether such 2D thermo-chemical disk models can produce conditions conducive to the observed JWST-MIRI spectra of disks around VLMS. More specifically, we seek to examine under which conditions such models generate the observed pseudo-continuum of C2H2. We also aim to find an explanation for the dichotomy of the presence of a large variety of hydrocarbons along with the major oxygen carriers CO and CO2. We note that CO2 has also been found in a number of other VLMS disks (e.g., Arabhavi et al. 2024; Kanwar et al. 2024a; Arabhavi et al. 2025a).
In this paper, we use the JWST-MIRI/MRS spectrum of J160532 from Tabone et al. (2023) that has been reduced with version 1.8.4 of the JWST Science Calibration Pipeline and CRDS context jwst_1017.pmap. Section 2 describes our approach in using 2D thermo-chemical disk models. We present a disk geometry that can explain the JWST-MIRI spectrum of J160532 in Sect. 3 and discuss how and why we reached this specific model geometry in Sect. 4. Based on these results, we propose how to break the degeneracy between oxygen depletion and carbon enrichment and provide an explanation for the coexistence of a rich hydrocarbon spectrum and CO2 emission. We discuss implications and limitations of our results in Sect. 5 and present our main conclusions in Sect. 6.
2 Method
To gain a deeper understanding of the physical and chemical structure of the disk and which characteristics can produce key features of the observed spectrum, we used the thermo-chemical protoplanetary disk model PRODIMO (Woitke et al. 2009; Woitke et al. 2016; Kamp et al. 2017).
2.1 Thermo-chemical modelling
We used PRODIMO to simulate the disk around the VLMS J160532. The code self-consistently calculates the thermal, physical and chemical structure of the disk. It solves 2D continuum radiative transfer to calculate the dust temperature structure. It then calculates the chemistry and gas temperature structure by balancing gas heating and cooling to determine the latter. We used the extended hydrocarbon chemical network developed by Kanwar et al. (2024b) after expanding over the large DIANA network (Kamp et al. 2017). This gas-phase network can form species as large as C8H +5. It forms ices (adsorption and desorption) for all the neutral species and radicals but does not consider surface chemistry. It also includes thermal decomposition and three-body reactions from the STAND network (Rimmer & Helling 2016). We primarily use reactions and adsorption energies from the UMIST Rate12 database (McElroy et al. 2013). We solved the chemistry in steady state. We adopted the elemental abundances from Woitke et al. (2016). The model takes into account UV molecular shielding (for details, see Woitke et al. 2024). The PRODIMO version used here is 0e87fc6e.
2.2 Line selection
We used the fast line transfer FLiTs described in Woitke et al. (2018) to calculate the mid-infrared spectrum. This code performs the full continuum and line radiative transfer and takes into account line overlap and non-LTE effects for molecules such as CO and H2O. We considered both ortho and para forms of H2O while calculating its spectrum. No isotopologues of CO were considered, as our disk chemistry does not account for isotopologue selective photodissociation.
Notably, FLiTs has the ability to capture both absorption and emission features of the spectrum. FLiTs produces two spectra: a dust continuum spectrum and a spectrum with dust continuum and molecular line emission on top. The dust continuum spectrum is subtracted from the total spectrum to obtain the molecular spectrum. The resulting spectrum is then convolved and resampled (using spectres, Carnall 2017) to the JWST-MIRI/MRS wavelength grid. We used a resolution R = 3500 for channel 1, 3000 for channel 2, and 2500 for channel 3. This makes the model output directly comparable to the manually continuum subtracted JWST-MIRI spectrum obtained from Tabone et al. (2023).
We used the HITRAN2020 (Gordon et al. 2022) spectroscopic database to obtain the Einstein coefficients, upper energy level Eu, degeneracies, and partition functions. The rules for line selection we adopted are mostly from Woitke et al. (2018) but have been modified for a few molecules, as we observe more transitions with JWST-MIRI/MRS. The lines we selected are between 4.89 and 20 µm. All of these lines are considered in the gas heating and cooling balance. The line strength is defined by Equation 2 in Woitke et al. (2018), and Table 1 lists our selection rules for this work. We used the new selection criterion for C2H2, as this molecule shows a forest of weak lines that contribute to the formation of a pseudo-continuum. Hence, all available lines are considered. A total of 300 levels are considered for CO (Thi et al. 2013) and we used collisional rates from (Balakrishnan et al. 2002, H), (Cecchi-Pestellini et al. 2002; Krems 2002, He), (Yang et al. 2010, H2), and Ristić et al. (2007, e– ) to calculate the non-LTE spectra. Our selection consists of 60 rotational levels in the ground electronic state along with five vibrational levels in the ground state. A total of six and 26 bands were considered for CO2 and HCN, respectively. For water, we used molecular data from the Leiden LAMDA database (van der Tak et al. 2020) including the collisional rates from Faure & Josselin (2008) to calculate non-LTE spectrum.
Line selection criteria for the HITRAN 2020 database.
2.3 Disk structure
We did not perform a systematic exploration of all disk parameters, as it is not feasible. This is because each model takes ∼11 000 seconds of CPU time. We applied observational constraints on parameters such as disk mass and stellar parameters. We explored a subset of parameters to arrive at a disk structure that best describes the observations. We employed a disk model described by an inner and outer zone separated by a gap. This structure is similar to the one discussed in Tabone et al. (2023), who also proposed a gap. Our aim was to deviate as little as possible from the canonical disk parameters of a T Tauri disk mentioned in Woitke et al. (2016) for the outer disk. Woitke et al. (2016), Kurtovic et al. (2021), and Pegues et al. (2021) have demonstrated that the outer disks around T Tauri and VLMS are similar; however, the size of these two types of disks can vary. Table 2 lists the parameters for both the inner and the outer disk. We assumed the grain size in the model follows an MRN power law distribution (Mathis et al. 1977) with a maximum grain size (amax) of 3 mm. The outer disk has a minimum grain size (amin) of 0.05 µm, while the inner disk has 5 µm. The relatively large grains in the inner disk are chosen to match the absence of the silicate feature in the JWST-MIRI/MRS observations. Kessler-Silacci et al. (2007); Olofsson et al. (2009) have shown that grains larger than ∼5 µm do not contribute to the silicate feature.
We adjusted the dust mass so that the photometric observations (Barenfeld et al. 2016; Luhman & Mamajek 2012) for the entire disk are roughly matched. We assumed a gas-to-dust mass ratio of 1000 to set the initial gas mass of the disk. This is based on Greenwood et al. (2019) and Pinilla et al. (2013), who demonstrated that for a viscosity of 10−3, the disk beyond 10 au can have a gas-to-dust mass ratio of 1000 after 1.5 Myr. The dust masses derived from SEDs are known to be degenerate (e.g., Kaeufer et al. 2023). Therefore, the uncertainty in the dust mass propagates to the gas mass. This is why we optimized it during our analysis. The final value of the disk mass is listed in Table 2 along with the other key model parameters. The dust mass is below the derived upper limit from the ALMA non-detection (Barenfeld et al. 2016). We assumed 1% of the total gas mass resides in the inner disk.
The resulting surface gas and dust density profile for our best model is shown in Fig. 1. We used a gradual build up of column density for the inner and outer disk as described in Woitke et al. (2024). The column density power index, ϵ, for the inner disk was assumed to be zero, leading to a constant gas surface density profile, which is the simplest assumption. The column density power index, ϵ, for the outer disk was assumed to be 1. As the emitting area of all the molecules derived using slab models in Tabone et al. (2023) is within 0.1 au, we fixed the outer radius of the inner disk to 0.1 au so that the model is likely to reproduce the slab conditions that were retrieved from observations. We also varied other parameters in our quest for the best model, such as the gas-to-dust mass ratio, C/O elemental ratio in both zones, the location of the gap, and the elemental abundances of O and C. Some of the models that we tested are listed in Appendix D.
We used the following list of molecules to explore a range of parameters with the 2D models in order to identify a disk model that captures the key observational aspects and provides a 2D context to the JWST spectrum: CO, CO2, C2H2, H2O. We used these molecules because the spectrum is dominated by the pseudo-continuum of the hydrocarbon C2H2 and the other three are oxygen-bearing species, which we used to derive constraints also on the C/O ratio. We did not model atomic and molecular hydrogen lines and molecules such as C4H2 and C6H6, as they are beyond the scope of this study.
Parameters for the model that best explains the observed fluxes.
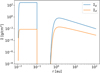 |
Fig. 1 Full disk gas and dust surface density profile in the best model. |
2.4 Analysis
For each model, we used FLiTs to generate the spectrum of the above listed molecules, convolved and resampled it to the JWST-MIRI/MRS wavelength grid, and compared the observed flux levels with the modelled flux levels. The disk model where the peak line fluxes of molecules such as C2H2 are in the range 13.54–13.75 µm, CO2 in the range 14.96–14.98 µm and most lines of CO are within a factor of 1.5 to the observed fluxes along with no observable water features is then considered to be the best model. It presents a possible disk geometry and elemental abundances that agree with the observations. A more detailed fitting of the observations with high accuracy is not the goal of this study.
From the best disk model, we calculated the characteristics of the emitting region of these molecules, including the temperature ⟨T⟩, column density ⟨log10 N⟩, and the emitting area ⟨r1 − r2⟩. They were calculated using the escape probability method assuming a face-on disk (Woitke et al. 2024) and are statistical averages over the individual line emitting regions of all the lines in a given spectral range and over all the vertical columns of a selected molecule. The total integrated flux generated by each column and the line of that molecule were chosen as its statistical weights.
3 A 2D thermo-chemical model for J160532
We present our identified best disk geometry in Fig. 2 with the parameters listed in Table 2. We first describe the key results from this model and then provide the arguments driving this choice of parameters in Sect. 4.
The molecular emission from our best model convolved and resampled to the JWST-MIRI/MRS resolution matches well with the observed spectrum (Fig. 3). As mentioned in Sect. 2.3, the disk is divided into an inner and outer disk that is separated by a gap. The outer disk resembles a typical disk with a ten times increase in gas-to-dust mass ratio relative to the canonical value of 100. The inner disk is extremely depleted in elemental oxygen and dust. The gas and dust thermal structure along with the gas density and UV radiation field are shown in Fig. A.1. The disk is largely optically thin, with the maximum optical depth of 0.7 acquired at 1.5 au at UV wavelengths (λ = 0.096 µm). This is a result of the presence of only large (>5.0 µm) grains in the inner disk. This best model is able to produce the molecular pseudo-continuum of C2H2. The model shows the large column densities of C2H2 required to obtain it. In our model, this is possible because of the low dust opacity. Woitke et al. (2024) also found that a low continuum optical depth exposed the C2H2 molecular reservoir and produced a strong emission feature.
The peak flux of C2H2 matches the JWST observations, whereas the P-branch is under predicted by ∼28% relative to the observations, and the R-branch is over-predicted by ∼24% (Fig. 3). The modelled flux of CO is at most ∼86% higher relative to the observations. The modelled CO2 peak emission is lower in flux relative to the observations by ∼33%.
The lack of emission from our model at ∼ 14 µm in the third panel of Fig. 3 is explained by the presence of HCN emission in the observations. When calculating the combined spectrum of C2H2 and HCN with FLiTs while taking into account the line opacities and overlap, we obtained flux levels close to the observations (within 10%, see Figure E.4). This confirms that HCN is blended with C2H2 as shown in Tabone et al. (2023).
The model underpredicts C2H2 at short wavelengths (6.8–8.5 µm) despite the contribution of emission from CH4. At these short wavelengths, we are limited by the incomplete spectroscopic line data for C2H2 in HITRAN. Tabone et al. (2023) proposed the presence of excited 13CCH2; however, we do not consider 13CCH2 in our model, as we are again limited by its incomplete spectroscopic data. In addition, the model reproduces the observations at long wavelengths (11–16 µm) fairly well using only the main isotopologue (Fig. 3, third panel).
To demonstrate the effect of the lack of spectroscopic data on the C2H2 molecular fluxes, we selected only the ν5 band of C2H2, the strongest mode that dominates the entire spectrum. We then re-calculated the molecular emission of C2H2 using FLiTs from the best-fit model (keeping the gas temperature fixed) and found that we under-predicted the peak flux of C2H2 at 13.71 µm by a factor of ∼5. Thus, weak lines are crucial to producing the molecular pseudo-continuum, and this exercise illustrates the need for a more complete spectroscopic database.
As a sanity check, we also confirmed that our best disk model produces only weak water features at short or long wavelengths (Fig. 3, fifth panel).
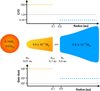 |
Fig. 2 Illustration showing the best disk model along with the assumed C/O ratio and gas-to-dust mass ratio in the disk. The corresponding gas mass of the two zones are shown. |
3.1 Model-based interpretation of the JWST spectrum
The emitting areas of our key molecules are shown in Fig. 4 for the best model. A complete overview of 2D molecular abundances can be found in Fig. B.1 in the appendix. The molecular emission of molecules such as C2H2, CH4, HCN, and CO originates from the inner disk. However, CO2 and faint H2O emission originate behind the inner wall of the outer disk. This is in line with results from Vlasblom et al. (2024), who also found CO2 to be excited in the cooler gas beyond disk gaps. The molecular emission of CH4 comes from deeper layers relative to CO and C2H2 that are somewhat co-spatial. However, the emitting region of C2H2 is radially more extended than CO. There is a tenuous surface layer of H2O in the inner disk, but it produces no significant emission. Most emission of H2O in our best model originates from the outer disk; however, the gas there is not warm enough to produce strong features.
To quantify the emitting conditions of the various molecules in our best 2D thermo-chemical disk model, Table 3 shows the values of gas temperature ⟨T⟩, column density ⟨log10 N⟩, and the radial extent of the emitting region ⟨r1 − r2⟩ derived using the line fluxes based on the escape probability method. The ranges shown are the standard deviation of the statistical average from all lines inside the wavelength range 4.9–19 µm.
We cannot compare the values obtained from the best disk model in Table 3 directly to those of the slab models (Tabone et al. 2023), as the disk model shows abundance and temperature gradients that are not always well captured in the averages obtained in Table 3 (Kamp et al. 2023). Kaeufer et al. (2024) have demonstrated that the JWST spectra of certain molecules are indeed better fit by radial power law slab models.
We find that the weak water emission in the JWST spectrum still implies 〈log10 N〉 of ~ 16 at 〈T〉 of ~ 300 K in the presence of a C/O ratio of 100. The 〈log10 N〉 obtained from disk model for H2O is wel below what is found in Tabone et al. (2023). We note we found a larger emitting area and a slightly different 〈T〉. We found CO2 temperatures cooler than those derived in Tabone et al. (2023). In our model, the temperature range for both H2O and CO2 is low, as they emit from the outer disk over a small temperature gradient. Hence, for CO2 we found much larger emitting area and a cooler temperature, contrary to Tabone et al. (2023). Nevertheless, they reported that C2H2 is warmer than CO2 and this trend is similar to what we found.
The hottest molecule in the best model is CO (~1400 K), emitting with high column densities (〈log10 N〉 ~ 20), but from very close-in (0.02 au). Despite the decrease of oxygen by a factor ~100, we found high levels of emission from CO. This also shows that CO easily becomes optically thick. The slab model retrievals for the temperature of CO are cooler for VLMSs than T Tauri stars, hinting that the disks around VLMSs are cooler (Pascucci et al. 2013). However, we found hot temperatures for CO and also detected the ν=2→1 transition that is indicative of warm inner regions. CH4 also has high column densities (〈log10 N〉~ 21.5), high temperatures (〈T〉~ 1150 K), and a similar emitting area. This produces a clear emission feature at 6.5 μm (see Fig. 3, second panel). It is the second-hottest molecule in our model and it also emits from a very narrow region closer to the central star.
We found high column densities for C2H2 similar to the findings of Tabone et al. (2023) and the formation of a pseudo-continuum. As the emitting area of C2H2 is large (~0.05 au) and vertically extended, the temperature gradient in this emitting region produces the large range of gas temperatures (〈T〉 ~ 818 ± 503 K). The values inferred from 0D slab models, T = 400–525 K, lie well within the range of temperatures inferred from our 2D model. The 2D structure automatically comprises optically thick and thin emitting conditions within the reported emitting region and has thus no problem reproducing the full band shape. We come back to this point in Sect. 4.5.
The emission of HCN is blended with C2H2. Tabone et al. (2023) provided an upper limit on the column density of HCN after fixing the temperature and the emitting area. We quantified the emitting conditions of HCN using our self-consistent model (see Table 3). We found large column densities in a smaller emitting region relative to the previously reported values from the 0D slab models. Overall, the spread in the values obtained from the 2D disk model includes the values retrieved from the 0D slab models of Tabone et al. (2023).
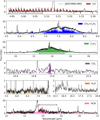 |
Fig. 3 Modelled spectrum of the best disk model convolved and resampled to the JWST-MIRI/MRS resolution and compared to the continuum subtracted observed spectrum. Tabone et al. (2023, Extended Data Figure 5) provide two different continua, and therefore, we used the continuum from their middle panel to depict C2H2 and CH4, whereas the continuum from their bottom panel is used to depict the rest of the molecules. The solid black line depicts the region where the modelled fluxes approximately match the observations. These are the regions where little effect from blending is expected. |
Characteristics of the emitting region of various molecules in the best disk model.
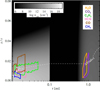 |
Fig. 4 Emitting region (4.89–19 µm) of different molecules in the model. The dashed contour corresponds to the radial Av of 1 mag. The disk model is optically thin in the vertical direction. |
3.2 Detection of CO ν= 2→1
Tabone et al. (2023) report the detection of the CO v = 1 → 0 fundamental band. Triggered by the spectrum derived from our best disk model, in this work we also report the detection of the CO v = 2 → 1 band. CO can be excited by UV (Krotkov et al. 1980), IR pumping (Scoville et al. 1980), or by collisions (Bosman et al. 2019). Figure 5 shows a zoom-in on the modelled CO emission along with the JWST/MIRI-MRS observation. The integrated flux predicted from the model matches the observed emission within 50%. The full shape of the CO ro-vib band at 4.7 µm (see Fig. E.3 for the full NIRSpec range using R = 2700) is an intricate superposition of the v = 1 → 0 and v = 2 → 1 bands, and it shows, for example, a minimum at 5.02 µm that is clearly visible both in the model and the observation.
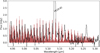 |
Fig. 5 Zoom-in of JWST/MIRI MRS spectrum (black) showing CO emission. The emission of CO from the best thermo-chemical model convolved to 3500 and resampled to JWST-MIRI/MRS resolution is shown in brown. The H I 10-6 line is marked in grey. |
3.3 CH4
Tabone et al. (2023) reported a tentative detection of CH4. In this section, we present further evidence of its presence in the spectrum, albeit strongly blended with C2H2 molecular emission. Figure 6, shows the modelled molecular emission of C2H2 only in the top panel and the combined emission of C2H2 and CH4 in the bottom panel, where line blending and the opacity overlap of both molecules are included. The emission from the P- and R-branch of C2H2 is symmetric about the black dashed line in the modelled spectrum (see Fig. 6, top panel). However, in the observations, the minimum emission in the butterfly pattern occurs at a location that is red-shifted (grey dashed line) compared to the model. This shift can be explained by the presence of the triply degenerate deformation ν4 mode of CH4 at 7.65 µm. The combined spectrum of C2H2 and CH4 in the bottom panel aligns well with the observations and the emission minimum in the modelled spectrum, and the observations occur at the wavelength indicated by the grey dashed line (see Fig. 6, bottom panel). The emission at 6.5 µm corresponds to the doubly degenerate deformation ν2 mode of CH4, which seems slightly overpredicted by our model. Still, we conclude that the broad emission feature at 7.5 µm can be explained best by the presence of both CH4 and C2H2.
We note that CH4 could be overpredicted because either it is less abundant than C2H2, thus lowering ⟨log10 N⟩, or it is much cooler than our model predicts. As thermochemical disk models are self-consistent, unlike slab models, the abundance is given by chemical considerations and is not a free parameter. This difference in abundance could be due to uncertainties in the rate coefficients of the reactions which affect the final abundances of the species.
Figures 5 and 6 (bottom panel) show that the continuum baseline could also be placed a bit lower, thus bringing our model predictions for CO at ∼4.98 µm and CH4 at 6.5 µm in better agreement with the observations.
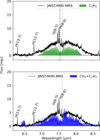 |
Fig. 6 Top panel: modelled flux of C2H2 using FLiTs. Bottom panel: modelled flux of C2H2 and CH4 together using FLiTs. The grey dashed line depicts where the ’dip’ in the observed spectrum occurs. The black dashed line shows the dip in flux in the best modelled spectrum. |
4 Justifying the best model
In the following we present the lessons learned from exploring a larger parameter space to arrive at our best model. We provide the justification for deciding on parameters such as the gap location, dust-to-gas mass ratio, and element abundances, and we suggest diagnostics to be developed further for a more general interpretation of the JWST spectra of disks.
4.1 Why and where to put a gap
When modelling a disk without any gap and using a high gas-to-dust mass ratio (105) and a high C/O ratio (100), we were unable to produce simultaneously the molecular fluxes of all the molecules we considered in this analysis. Increasing the gaseous C/O ratio in a continuous disk resulted in extremely weak molecular emission of CO2 and strong emission of CO even at a C/O ratio of 100 (see Fig. D.1). Hence, we introduced a gap in the disk, leading to an inner and outer disk.
The outer disk acts as an oxygen reservoir. For example, if the inner and outer disks both have a high C/O ratio (inner: C/O = 100, outer: C/O = 10) , we still lack detectable emission from CO2 (see Fig. D.2). Hence, an oxygen reservoir in the outer disk is required to produce detectable CO2 molecular emission, unless there is any other efficient mechanism to produce CO2 when the C/O ratio is high. If we use a low C/O ratio in the outer disk, CO closely matches the observation because its emission originates from the inner disk with the high C/O ratio (C/O = 100). Therefore, these C/O ratios are adopted in the best model (Sect. 3).
We are only able to reproduce the spectrum with the given parameter space exploration when the disk has a gap present from 0.1 to 0.5 au. The flux levels of CO2 and CO are very sensitive to the location of this gap. Although, the best-fit model does not perfectly match the observed line fluxes, moving the inner edge of the outer disk inwards increases the line flux for CO. This is because the CO in the outer disk becomes hot and starts to emit from the outer oxygen-rich disk. Thus, even if the fluxes only match within a factor of at most 1.5, the location of the outer edge of the gap is well-constrained within our modelling framework. Moving the inner edge of the outer disk outwards decreases the CO2 flux, as the gas becomes too cool to produce detectable features in the mid-IR spectrum. If the outer edge of the inner disk is moved outwards, the emitting area of species such as C2H2 increases along with the decrease in the column density, thus again deviating from the observations.
4.2 The dust-to-gas ratio in the inner disk
The inferred molecular column densities of C2H2 over the dust continuum are huge, ∼1020 cm−2 (Tabone et al. 2023). Such column densities can only be achieved in our model by depleting the disk in dust and lowering the dust-to-gas mass ratio to 10−5. This makes the inner disk almost optically thin (see Fig. 4). An alternative way to achieve a high column density for C2H2 is by increasing the gas mass of the inner disk. This could help reduce the C/O ratio required to obtain the high C2H2 column densities. However, an increase in gas mass will also lead to a rise in CO flux. To counteract this, the C/O ratio must be even further increased beyond 100. Therefore, the presence of both the pseudo-continuum of C2H2 and CO can be used to better constrain the C/O ratio in the inner disk.
We assumed the dust-to-gas ratio to be 0.001 in the outer disk. If we use a dust-to-gas ratio of 0.01 instead, only the peak fluxes of CO2 and H2O subtly decrease because only these two molecules are emitted from the outer disk.
4.3 Depletion of oxygen
One can change the C/O ratio in the disk by depleting elemental oxygen or enriching the disk in carbon. We varied the C/O ratio using values of 0.45, 1, 1.5, 5, 10, 20, 50, 80, and 100 in the disk by depleting the elemental oxygen. Figure 7 shows the effect of this depletion on the integrated line flux of CO between 4.93–5.29 µm, H2O between 4.89–18.47 µm and C2H2 between 11.66–17.28 µm. The black solid line indicates the integrated observed CO flux in the respective wavelength range, and the uncertainty was calculated on the basis of the continuum placement. To calculate this uncertainty, we placed the continuum at the base of the line features; some of the CO lines drop below the continuum baseline assumed in Tabone et al. (2023) (see Fig. 5). Placing a more conservative continuum provides an upper limit on the integrated CO flux. The H2O upper limit was calculated by integrating the flux produced by a 0D slab model with 400 K, a column density of 8×1017 cm−2, and an emitting area of 0.07 au over 4.89–18.47 µm. We integrated only the C2H2 band at the longer wavelength for comparison because we know that we underpredict the flux at short wavelengths due to lack of molecular data (see Sect. 3.1).
An increase in the C/O ratio leads to a decrease in line fluxes of CO and H2O. Oxygen is the limiting factor here in the formation of CO and H2O. Thus, the abundance of CO decreases with the depletion in oxygen. We get closer to the observed value with a C/O of 100 (see top panel of Fig. 3 and Fig. 7). Interestingly, we also noticed an increase in the CO flux between a C/O of 0.45 and 5. This is due to a gas temperature increase that results from a lower H2O line cooling. As we traverse deeper into the disk, 12CO quickly becomes optically thick. The models show that the gas continues to become hotter, leading to the production of strong CO flux levels even when the C/O ratio is as large as 100. This also explains its shallow dependence on the C/O ratio for values larger than 50. Noticeably, CO and C2H2 can co-exist even when the C/O ratio is large.
The C2H2 flux rises drastically once the C/O ratio reaches a value of 1.5, and then it continues to rise gradually with an increasing C/O ratio (see bottom panel of Figs. 7 and 10). At the C/O ratio of 5, the model is able to form a strong molecular pseudo-continuum given the low dust-to-gas mass ratio (Sect. 4.2 and Fig. 10). However, the C/O ratio of 5 still over-predicts CO, and we required a further decrease of the oxygen abundance. The modelled emission matches the observations better when the C/O ratio is 100. Thus, in our modelling framework, a low C/O ratio is not able to produce the required molecular pseudo-continuum simultaneously with a low CO line flux. The presence of a molecular pseudo-continuum of C2H2 and low flux levels of CO are a powerful diagnostic to better constrain the C/O ratio in both the inner and outer disks.
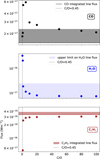 |
Fig. 7 Effect of the depletion of oxygen to enhance the C/O ratio on the integrated line flux of CO (4.936–5.298 µm), H2O (4.891–18.474 µm), and C2H2 (11.664–17.289 µm). The black horizontal line shows the CO observed integrated flux, with the grey area indicating the error. The blue shaded area shows the H2O upper limit, and the brown line and shaded area show the integrated observed flux of C2H2 and its associated error. The C2H2 flux for the model with a C/O ratio of 0.45 was low (∼6×10⁻¹⁹ Wm−2) and is therefore not shown. The dotted vertical line highlights the model with a typical C/O ratio of 0.45. |
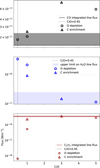 |
Fig. 8 Effect of the depletion of oxygen and enrichment of carbon to enhance the C/O ratio on the integrated line flux of CO (4.936–5.298 µm) and H2O (4.891–18.474 µm) and C2H2 (11.664–17.289 µm). The circles and triangles represent models where oxygen was depleted and carbon was enriched, respectively, to attain a high C/O elemental ratio. The solid horizontal brown line depicts the integrated C2H2 flux. The solid black line denotes the integrated observed line flux of CO, and the dotted vertical line shows the model with a typical C/O ratio of 0.45 similar to Fig. 7. |
4.4 Enhancement of carbon
When enriching the inner disk with carbon to obtain a C/O ratio of 1, we find that the molecular flux of CO is ∼13% higher than in the model where oxygen was depleted to achieve a C/O ratio of 1 (see Figs. E.1 and 8). When enhancing carbon further to yield a C/O ratio of 3, there is even more emission from CO due to most of the available oxygen becoming locked in CO. This also reduces the H2O abundance, resulting in less water line cooling, and thus higher gas temperatures and higher molecular fluxes (see black triangles in Fig. 8).
In general, the C2H2 flux is underpredicted relative to the observations when the C/O ratio is 1 and slightly overpredicted when the C/O ratio is 3. In this latter case, we produced a pseudo-continuum of C2H2 with a stronger Q-branch relative to the pseudo-continuum compared to the case of oxygen depletion. Figure E.2 (and Fig. 8) shows the difference in the spectrum when a C/O of 1 is attained either by depleting oxygen or by enriching carbon and a simultaneous decrease in CO emission. The depletion of oxygen and enrichment of carbon thus lead to very different mid-IR spectra for the same C/O ratio. The rise in the flux levels of the molecules C2H2 and CO with increasing C abundance could be counteracted by increasing the dust-togas ratio. However, enhancing the C/O ratio by enriching the gas with carbon always increases the emission from C2H2 and CO simultaneously because all the available oxygen is locked in CO. On the other hand, the depletion of oxygen allows for an increase in molecular emission from C2H2 and a simultaneous decrease in CO emission. Thus, increasing carbon to enhance C/O does not suppress the CO molecular emission compared to C2H2, while this is exactly what our disk models require to match the JWST observations.
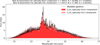 |
Fig. 9 Model of the 0D slab fit to the 2D modelled spectrum of C2H2, which has been convolved to a resolution of 2500 and resampled to JWST-MIRI/MRS. The light red and dark red colors depict the optically thin and thick component, respectively. |
4.5 C2H2 emission
Tabone et al. (2023) used two distinct components to explain the optically thin and thick emission of C2H2. Our 2D disk model can explain the observations by a vertically and radially extended emitting region of C2H2. When analysing the spectral range of only the Q-branch (13.5–13.76 µm) in the model, we found similar column densities and emitting areas as reported in Table 3 for the entire C2H2 band, showing that the Q-branch dominates the statistical averages.
To further investigate how to bring the slab models and 2D disk models together, we fitted slab models to our simulated C2H2 spectrum (best model convolved to a resolution of 2500 and resampled). We used the slab models described in Arabhavi et al. (2024) and Kanwar et al. (2024a). We find that a single slab component is not able to produce the optically thin features of the simulated C2H2 band from the 2D model along with the pseudo-continuum. Hence, we had to also use two slab components. We fixed the temperature to T = 500 K for the optically thick and thin components and retrieved column densities of N = 1020 and 1017 cm−2 with emitting areas of 0.04 and 0.06 au, respectively (Fig. 9). These column densities are similar to those derived by Tabone et al. (2023) from JWST/MIRI-MRS observations using the same approach. We also found the optically thin component to be more radially extended than the thick component, similar to Tabone et al. (2023). Based on this work, we find that the 2D emitting conditions of a thermo-chemical disk model can indeed be reproduced by a two-component 0D slab model.
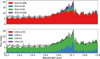 |
Fig. 10 Effect of UV luminosity, LUV, (upper panel) and C/O ratio (lower panel) on the C2H2 emission band at 13.5 µm. The parameter fUV denotes the ratio between LUV and L⋆. All models in the lower panel correspond to an fUV value of 0.026. |
4.6 C2H2 tracing UV luminosity
Earlier, we found that our molecular fluxes react sensitively to the gas temperature. J160532 has an estimated mass accretion rate of 10−10−10−9 M⊙ yr−1, and we know that the mass accretion rate can be highly variable. This can result in varying levels of UV luminosity irradiating the disk.
Pascucci et al. (2013) inferred a UV luminosity of 2.5 × 10⁻⁴ L⊙ for J160532 using a mass accretion rate of log Macc = −9.1 and empirical scaling relations. Variability and uncertainties in the extinction lead to a large scatter in such empirical relations and thus also in luminosity estimates (Yang et al. 2012). The model C2H2 emission using this UV luminosity ( fUV = LUV/L∗ = 0.008) does not produce a visible Q-branch (red spectrum in Fig. 10, upper panel). However, when increasing LUV by a factor ∼3 to 7.8 × 10⁻⁴ L⊙ ( fUV = 0.026), we were able to reproduce the observed Q-branch. The strength of the Q-branch increases with the LUV and this trend is similar to the findings of Woitke et al. (2024) for EX Lup. The Q-branch is generated by the optically thin surface layers of C2H2, whereas the weak lines in the P- and R-branch are emitted from deeper layers in the disk (see Fig. C.1). Analysing the emitting conditions of the Q-branch separately, we found that the average gas temperature weighted with the abundance of C2H2 is lower in models with low a LUV relative to models with a high LUV. Increasing the UV luminosity of the central star leads to an increase in the gas temperature, but only in the surface layers. As the P- and R-branch probe deeper layers, the flux from these lines changes very little.
Increasing LUV to 7.8 × 10⁻⁴ L⊙ also impacts the flux and properties of molecules such as CO, HCN, and CH4. The integrated flux of CO increases by 39% if the fUV is increased from 0.008 to 0.026. In general, the molecular emission of these molecules decreases with increasing LUV. Our final best model uses this high UV luminosity, and the emission of these two molecules is consistent with the observations.
5 Discussion
We discuss in the subsequent paragraphs, we discuss the scenarios for a very high C/O ratio, the caveats in the modelling, and future observations.
5.1 Scenarios for a very high C/O ratio
Several earlier works investigated the impact of the C/O ratio on the disk chemistry and molecular emission (e.g., Lee et al. 2010; Najita et al. 2011; Woitke et al. 2018; Wei et al. 2019; Anderson et al. 2021). However, none of them considered values as extreme as 100. In the following, we briefly discuss the scenarios proposed in the literature and comment on whether they could lead to extreme C/O ratios.
We assumed a disk gap both in the dust and the gas as mentioned in Sect. 2.3. The gap is crucial to producing the molecular emission from different species simultaneously. Gaps in disks can be formed by planet-disk interaction but also by other mechanisms, such as zonal flows (Johansen et al. 2009) or dead zones (Flock et al. 2015). Gillon et al. (2017) reported extremely small semi-major axes for the seven planets found around TRAPPIST-1 (all orbit inside 0.07 au). So our proposed gap could have been created by one or more planets. Which planet masses are required to open such a gap requires further investigation.
Our best disk model suggests that the inner disk is devoid of oxygen and not enhanced in carbon. One way to achieve this state is when the frozen water on cold grains remains locked in the outer disk due to the presence of a deep gap. The second possibility is that the water-rich grains have already drifted inwards and subsequently enriched the gas with oxygen, and this gas has then long accreted onto the central star. The timescales of dust growth and drift are very short in disks around VLMSs (Pinilla 2022). So each of these scenarios are equally likely depending on when and where the gap is formed. Kalyaan et al. (2023), Mah et al. (2024), and Sellek et al. (2025) studied the effect of the presence of a gap on pebble transport and the elemental abundances in the disk; Lienert et al. (2025) studied the influence of photoevaporation on the elemental abundances of the inner disk. Sellek & van Dishoeck (2025, Fig. 5) reached a C/O > 10 by depleting oxygen when an initial warm gap is present at 5 au and there is a high cosmic ray ionisation rate of ζ = 10−17 s−1, which helps convert CO into the less volatile CH4. A C/O ∼5 is required within our model framework to produce a strong pseudo-continuum for C2H2. However, a larger C/O ratio still produces an even better match for the entire MIRI spectrum. Mah et al. (2024) introduced a gap at 3 au at the birth of the disk (t = 0) around a solar-type star for a high viscosity disk (α = 10−3) and they found that the C/O becomes super-stellar after a span of 4 Myr. However, the maximum C/O ratio they attained was only ∼3. The timescale to achieve such values could be much shorter for disks around VLMSs due to the faster evolution. Based on our modeling, we also found that the gap is located much closer to the star, between 0.1 and 0.5 au. In addition, Mah et al. (2024) find that the time of gap formation affects the temporal evolution of C/O in the inner disk. So we would need a more detailed modelling of the transport processes specifically in disks around VLMS including a wide range of gap locations, width, and time of formation to fully explore the possible range of oxygen depletion.
Conversely, enrichment of carbon by the irreversible destruction of refractory organics to C2H2 is explored in Houge et al. (2025). They find C/O∼1 for a disk viscosity of α = 10−3. If we enrich carbon in our thermo-chemical models so that the C/O ratio is 1, the line fluxes of C2H2 become lower than the observations, as shown in Fig. 8. We would require a ratio of 3 to get close to the observed C2H2 flux level.
Another suggested way to a high C/O ratio is the stellar accretion rate (Colmenares et al. 2024). The enrichment of carbon via sublimation leads to hydrocarbon chemistry. Sources with a high mass accretion rate such as Sz114 will accrete this C-rich gas onto the star, while sources with low accretion rates such as J160532 and Sz28 leave the disk enough time for the C-rich gas to be transported to the surface layers. It is still unclear what level of carbon enrichment can be reached in this way.
5.2 Optically thin inner disk
We find that to achieve very high column densities for C2H2, a high C/O ratio along with a dust depleted inner disk is required. This implies that the inner disk is optically thin in dust. The fact that many disks lack silicate features can indicate that the grains are on average larger than a few microns; this leads to lower dust opacities compared to the commonly used dust grain size distribution. In addition, the detection of 13CCH2 emission also indicates that deeper layers are probed.
The specific disk structure we propose in this paper is able to explain the key spectral features observed in J160532. However, Arabhavi et al. (2025a) have also demonstrated that there is a wide chemical diversity among the disks around such VLMSs. An optically thin inner disk with a high C/O ratio could be a general feature to explain disks that show a pseudo-continuum of hydrocarbons in the MIRI spectra. However, not all aspects of the model can be generalized. For example, disks around Sz114 and 2MASS J15582981–2310077 may require alternative disk structures to explain the presence of strong H2O emission. Thus, this work present a first step in understanding the intricate disk structure information potentially encoded in these MIRI spectra.
Long et al. (2025) took the column density ratio of C2H2 and CO2 as a proxy for the C/O ratio and report a value of ∼1.5 for J160532. This approach assumes that these molecules share the same reservoir, and that the column densities trace similar regions in the disk. However, within our modelling framework, CO2 and C2H2 reside in different locations in the disk: the outer and inner disk respectively.
5.3 Caveats in the modelling
We are able to explain the presence of the observed large column densities of hydrocarbons in the J160532 disk solely on the basis of the gas-phase chemistry and disk geometry. There is no ice formation in our inner disk due to high temperatures. The large grain sizes used in our model provide little opacity, and hence UV radiation penetrates the midplane and prevents effi-cient ice formation even in colder environments. Thus, invoking surface chemistry will likely not cause changes in the determined parameters.
Changing the absolute initial elemental abundances of C and O directly rather than the C/O ratio, assuming solar initial elemental abundances for other elements, can also lead to a similar chemistry. However, such changes also lead to differences in the spectrum. A systematic approach of varying elemental abundances and studying its effects on mid-IR spectra is explored in Arabhavi et al. (2025c).
ALMA observations are crucial for determining grain sizes in this disk and especially to inform the minimum grain size assumed for the outer disk. Small grains could provide more shielding for molecules such as CO2. However, we did not see much effect on the CO2 and H2O fluxes when using a larger minimum grain size (5 µm) and a gas-to-dust mass ratio of 1000 in the outer disk.
The heating and cooling processes are crucial to determining the gas temperature, and this property is closely intertwined with the chemistry. We include many such processes in the model (Woitke et al. 2009, 2024), and the cooling rates are more complete for simple abundant molecules such as C2H2, CH4, CO, CO2, and H2O. However, when using a high C/O ratio, cooling by other hydrocarbons may also become crucial to reliably determine the gas temperature. For J160532, the entire mid-IR spectrum is dominated by C2H2 emission and its pseudo-continuum. The heating and cooling processes associated with this molecule are included in the model, and therefore, the changes in the thermal structure may not be very large. The specific C/O ratio itself and how it affects the water cooling could have a larger effect on the thermal structure. In fact, the water abundance and cooling in the surface layers reacts sensitively to our model parameters and small changes could lead to stronger water lines.
The width of the Q-branch of CO2 is narrow in our best model due to it originating in low-temperature gas. The overall CO2 flux is affected by parameters such as the C/O ratio and the gas-to-dust mass ratio in the outer disk along with the gap location. We show that the C/O in the outer disk cannot be smaller than ∼ 0.1 (such as 0.05) as CO then begins to emit from the outer disk with no dependency on the inner edge of the outer disk (see Fig. D.3). The C/O and gas-to-dust mass ratio in the outer disk are degenerate with the position of the inner edge of the outer disk. Within our explored parameters, we could not make the CO2 gas hot.
We show that the gas elemental abundances are crucial in determining the chemistry in the disk. This model assumes a set of elemental abundances (see Sect. 2.1), that are not self-consistently informed by any radial drift models (Krijt et al. 2018, Mah et al. 2023, 2024). Instead, they were changed in an ad hoc manner at the gap location. More realistic 2D elemental abundance gradients informed by transport models could affect the detailed disk geometry required to reproduce the JWST spectrum as well as the gas-to-dust mass ratios.
5.4 Future observations
Overall, we lack strong observational constraints for the disk around J160532, but also VLMS disks in general. Future observations can aid to better constrain the disk parameters required in 2D disk modelling. The gas-mass used in our models is consistent with the estimates derived from the ALMA non-detection (Barenfeld et al. 2016) and H2 lines observed with JWST-MIRI (Franceschi et al. 2024). In the best disk model, the continuum emission at 1.22 mm is 0.035 mJy, thus below the ALMA upper limit. So, deeper ALMA observations can help better constrain the mass of the disk (or at least the outer disk). ALMA observations in multiple bands could also constrain the grain sizes in the outer disk. Given how faint J160532 is, resolving the proposed gap structure with ALMA or ground-based instruments will remain a challenge. Upcoming facilities such as METIS/ELT will be able to spectrally resolve molecular lines and inform us about their emitting regions.
6 Conclusions
We have modeled the disk around the VLMS J160532 using the 2D thermo-chemical disk model PRODIMO. We arrived at a structured disk model with a gap between 0.1 and 0.5 au that closely matches the observed JWST-MIRI/MRS spectrum. Below, we provide our take away messages.
The model forms a molecular pseudo-continuum of C2H2 with a column density of ∼1020cm−2. This required an almost transparent inner disk, i.e. a low dust opacity with large grain sizes (≥5 µm) and settling. The detailed shape of the emission of C2H2 can be explained by a radially and vertically extended emitting region in our 2D disk model.
We find that the Q-branch of C2H2 probes the surface layers of the disk whereas the P- and R-branches trace the deeper layers of the disk. Hence, the Q-branch of C2H2 is sensitive to the UV luminosity, LUV, of the central star in our modelling framework. The UV luminosity affects mostly the gas temperature in the surface layers, which is where the Q-branch originates.
Within our modelling framework, the emission from molecules such as C2H2, CH4, HCN, and CO originate from the inner disk. In contrast, the CO2 and H2O emission originate behind the inner wall of the outer disk.
The location of the gap is informed by the CO and CO2 fluxes. The gap is placed in a way to avoid any contribution of the outer disk to the CO flux while keeping CO2 hot enough to emit.
The presence of C2H2 along with CO is an indicator of the C/O ratio. We find that a large C/O ratio of ∼100 suppresses the CO emission lines and closely matches the observations. In our modelling framework, a C/O ratio of 5 produces a molecular pseudo-continuum of C2H2 that is similar in strength to the observations.
We find that the combination of molecular fluxes can break the degeneracies in elemental abundances. The depletion of oxygen to increase the C/O ratio can reduce CO emission and boost C2H2, simultaneously, whereas the enrichment of carbon to increase the C/O ratio boosts fluxes of both molecules together.
We report the detection of the CO ν= 2→1 transition in the disk around J160532.
This work shows the immense potential of detailed 2D thermochemical disk models to analyse and interpret JWST-MIRI observations. While 0D slab models can provide much better overall fits to the molecular emission, the extracted emission conditions lack a physical and chemical context. Here, thermo-chemical models such as PRODIMO can access additional information in these spectra that simpler approaches cannot. With this work, we have also demonstrated for the first time the potential of indirect spatial information encoded in such JWST-MIRI spectra from point sources.
Data availability
The JWST MIRI/MRS data of the source 2MASS-J1605321-1993159 that supports the findings of this study are openly available at https://doi.org/10.17909/wm8k-3w89.
Acknowledgements
This work is based on observations made with the NASA/ESA/CSA James Webb Space Telescope. The data were obtained from the Mikulski Archive for Space Telescopes at the Space Telescope Science Institute, which is operated by the Association of Universities for Research in Astronomy, Inc., under NASA contract NAS 5-03127 for JWST. These observations are associated with program #1282. The following National and International Funding Agencies funded and supported the MIRI development: NASA; ESA; Belgian Science Policy Office (BELSPO); Centre Nationale d’Etudes Spa-tiales (CNES); Danish National Space Centre; Deutsches Zentrum fur Luft-und Raumfahrt (DLR); Enterprise Ireland; Ministerio De Economía y Com-petividad; Netherlands Research School for Astronomy (NOVA); Netherlands Organisation for Scientific Research (NWO); Science and Technology Facilities Council; Swiss Space Office; Swedish National Space Agency; and UK Space Agency. J.K., T.K., I.K., P.W. acknowledge support from the European Union’s Horizon 2020 research and innovation programme under the Marie Sklodowska-Curie grant agreement No. 860470 for this work. T.K. acknowledges support from STFC Grant ST/Y002415/1. YL acknowledges financial supports by the National Natural Science Foundation of China grant number 11973090, and by the International Partnership Program of Chinese Academy of Sciences grant number 019GJHZ2023016FN. B.T. is a Laureate of the Paris Region fellowship program, which is supported by the Ile-de-France Region and has received funding under the Horizon 2020 innovation framework program and Marie Sklodowska-Curie grant agreement No. 945298. T.H. acknowledge support from the European Research Council under the Horizon 2020 Framework Program via the ERC Advanced Grant Origins 83 24 28. E.v.D. and M.V. acknowledges support from the ERC grant 101019751 MOLDISK and the Danish National Research Foundation through the Center of Excellence “InterCat” (DNRF150). I.K., A.M.A., and E.v.D. acknowledge support from grant TOP-1 614.001.751 from the Dutch Research Council (NWO). D.B. has been funded by Span-ish MCIN/AEI/10.13039/501100011033 grants PID2019-107061GB-C61 and No. MDM-2017-0737. We thank our referee Jenny K. Calahan for her constructive comments that help improve the paper.
References
- Anderson, D. E., Blake, G. A., Cleeves, L. I., et al. 2021, ApJ, 909, 55 [NASA ADS] [CrossRef] [Google Scholar]
- Arabhavi, A. M., Kamp, I., Henning, T., et al. 2024, Science, 384, 1086 [NASA ADS] [CrossRef] [Google Scholar]
- Arabhavi, A. M., Kamp, I., Henning, T., et al. 2025a, A&A, 699, A194 [NASA ADS] [CrossRef] [EDP Sciences] [Google Scholar]
- Arabhavi, A. M., Kamp, I., van Dishoeck, E. F., et al. 2025b, ApJ, 984, L62 [Google Scholar]
- Arabhavi, A. M., Kamp, I., & van Dishoeck, E. F. et. al. 2025c, A&A, submitted [Google Scholar]
- Balakrishnan, N., Yan, M., & Dalgarno, A. 2002, ApJ, 568, 443 [NASA ADS] [CrossRef] [Google Scholar]
- Barenfeld, S. A., Carpenter, J. M., Ricci, L., & Isella, A. 2016, ApJ, 827, 142 [Google Scholar]
- Bosman, A. D., Banzatti, A., Bruderer, S., et al. 2019, A&A, 631, A133 [NASA ADS] [CrossRef] [EDP Sciences] [Google Scholar]
- Carnall, A. C. 2017, arXiv e-prints, [arXiv:1705.05165] [Google Scholar]
- Carpenter, J. M., Ricci, L., & Isella, A. 2014, ApJ, 787, 42 [NASA ADS] [CrossRef] [Google Scholar]
- Cecchi-Pestellini, C., Bodo, E., Balakrishnan, N., & Dalgarno, A. 2002, ApJ, 571, 1015 [NASA ADS] [CrossRef] [Google Scholar]
- Colmenares, M. J., Bergin, E. A., Salyk, C., et al. 2024, ApJ, 977, 173 [NASA ADS] [CrossRef] [Google Scholar]
- Faure, A., & Josselin, E. 2008, A&A, 492, 257 [NASA ADS] [CrossRef] [EDP Sciences] [Google Scholar]
- Flock, M., Ruge, J. P., Dzyurkevich, N., et al. 2015, A&A, 574, A68 [NASA ADS] [CrossRef] [EDP Sciences] [Google Scholar]
- Franceschi, R., Henning, T., Tabone, B., et al. 2024, A&A, 687, A96 [NASA ADS] [CrossRef] [EDP Sciences] [Google Scholar]
- Gaia Collaboration (Vallenari, A., et al.) 2023, A&A, 674, A1 [NASA ADS] [CrossRef] [EDP Sciences] [Google Scholar]
- Gillon, M., Triaud, A. H. M. J., Demory, B.-O., et al. 2017, Nature, 542, 456 [NASA ADS] [CrossRef] [Google Scholar]
- Gordon, I. E., Rothman, L. S., Hargreaves, R. J., et al. 2022, J. Quant. Spec. Radiat. Transf., 277, 107949 [NASA ADS] [CrossRef] [Google Scholar]
- Greenwood, A. J., Kamp, I., Waters, L. B. F. M., et al. 2017, A&A, 601, A44 [NASA ADS] [CrossRef] [EDP Sciences] [Google Scholar]
- Greenwood, A. J., Kamp, I., Waters, L. B. F. M., Woitke, P., & Thi, W. F. 2019, A&A, 626, A6 [NASA ADS] [CrossRef] [EDP Sciences] [Google Scholar]
- Henning, T., & Semenov, D. 2013, Chem. Rev., 113, 9016 [Google Scholar]
- Henning, T., Kamp, I., Samland, M., et al. 2024, PASP, 136, 054302 [NASA ADS] [CrossRef] [Google Scholar]
- Houge, A., Johansen, A., Bergin, E., et al. 2025, A&A, 699, A227 [NASA ADS] [CrossRef] [EDP Sciences] [Google Scholar]
- Johansen, A., Youdin, A., & Klahr, H. 2009, ApJ, 697, 1269 [Google Scholar]
- Kaeufer, T., Woitke, P., Min, M., Kamp, I., & Pinte, C. 2023, A&A, 672, A30 [NASA ADS] [CrossRef] [EDP Sciences] [Google Scholar]
- Kaeufer, T., Min, M., Woitke, P., Kamp, I., & Arabhavi, A. M. 2024, A&A, 687, A209 [NASA ADS] [CrossRef] [EDP Sciences] [Google Scholar]
- Kalyaan, A., Pinilla, P., Krijt, S., et al. 2023, ApJ, 954, 66 [NASA ADS] [CrossRef] [Google Scholar]
- Kamp, I., Henning, T., Arabhavi, A. M., et al. 2023, Faraday Discuss., 245, 112 [NASA ADS] [CrossRef] [Google Scholar]
- Kamp, I., Thi, W. F., Woitke, P., et al. 2017, A&A, 607, A41 [NASA ADS] [CrossRef] [EDP Sciences] [Google Scholar]
- Kanwar, J., Kamp, I., Jang, H., et al. 2024a, A&A, 689, A231 [NASA ADS] [CrossRef] [EDP Sciences] [Google Scholar]
- Kanwar, J., Kamp, I., Woitke, P., et al. 2024b, A&A, 681, A22 [NASA ADS] [CrossRef] [EDP Sciences] [Google Scholar]
- Kessler-Silacci, J. E., Dullemond, C. P., Augereau, J. C., et al. 2007, ApJ, 659, 680 [NASA ADS] [CrossRef] [Google Scholar]
- Kirkpatrick, J. D., Gelino, C. R., Cushing, M. C., et al. 2012, ApJ, 753, 156 [NASA ADS] [CrossRef] [Google Scholar]
- Krems, R. V. 2002, J. Chem. Phys., 116, 4525 [Google Scholar]
- Krijt, S., Schwarz, K. R., Bergin, E. A., & Ciesla, F. J. 2018, ApJ, 864, 78 [Google Scholar]
- Krotkov, R., Wang, D., & Scoville, N. Z. 1980, ApJ, 240, 940 [Google Scholar]
- Kurtovic, N. T., Pinilla, P., Long, F., et al. 2021, A&A, 645, A139 [EDP Sciences] [Google Scholar]
- Labiano, A., Argyriou, I., Álvarez-Márquez, J., et al. 2021, A&A, 656, A57 [NASA ADS] [CrossRef] [EDP Sciences] [Google Scholar]
- Lee, J.-E., Bergin, E. A., & Nomura, H. 2010, ApJ, 710, L21 [Google Scholar]
- Liebert, J., & Probst, R. G. 1987, ARA&A, 25, 473 [Google Scholar]
- Lienert, J. L., Bitsch, B., & Henning, T. 2025, A&A, 700, A67 [NASA ADS] [CrossRef] [EDP Sciences] [Google Scholar]
- Long, F., Pascucci, I., Houge, A., et al. 2025, ApJ, 978, L30 [Google Scholar]
- Luhman, K. L., & Mamajek, E. E. 2012, ApJ, 758, 31 [Google Scholar]
- Mah, J., Bitsch, B., Pascucci, I., & Henning, T. 2023, A&A, 677, L7 [CrossRef] [EDP Sciences] [Google Scholar]
- Mah, J., Savvidou, S., & Bitsch, B. 2024, A&A, 686, L17 [NASA ADS] [CrossRef] [EDP Sciences] [Google Scholar]
- Mathis, J. S., Rumpl, W., & Nordsieck, K. H. 1977, ApJ, 217, 425 [Google Scholar]
- McElroy, D., Walsh, C., Markwick, A. J., et al. 2013, A&A, 550, A36 [NASA ADS] [CrossRef] [EDP Sciences] [Google Scholar]
- Morales-Calderón, M., Jang, H., Arabhavi, A. M., et al. 2025, A&A, 703, A18 [NASA ADS] [CrossRef] [EDP Sciences] [Google Scholar]
- Najita, J. R., Ádámkovics, M., & Glassgold, A. E. 2011, ApJ, 743, 147 [NASA ADS] [CrossRef] [Google Scholar]
- Olofsson, J., Augereau, J. C., van Dishoeck, E. F., et al. 2009, A&A, 507, 327 [NASA ADS] [CrossRef] [EDP Sciences] [Google Scholar]
- Ormel, C. W., Liu, B., & Schoonenberg, D. 2017, A&A, 604, A1 [NASA ADS] [CrossRef] [EDP Sciences] [Google Scholar]
- Pascucci, I., Apai, D., Luhman, K., et al. 2009, ApJ, 696, 143 [Google Scholar]
- Pascucci, I., Herczeg, G., Carr, J. S., & Bruderer, S. 2013, ApJ, 779, 178 [NASA ADS] [CrossRef] [Google Scholar]
- Pegues, J., Öberg, K. I., Bergner, J. B., et al. 2021, ApJ, 911, 150 [NASA ADS] [CrossRef] [Google Scholar]
- Perotti, G., Kurtovic, N. T., Henning, T., et al. 2025, arXiv e-prints [arXiv:2504.11424] [Google Scholar]
- Pinilla, P. 2022, Euro. Phys. J. Plus, 137, 1206 [Google Scholar]
- Pinilla, P., Birnstiel, T., Benisty, M., et al. 2013, A&A, 554, A95 [NASA ADS] [CrossRef] [EDP Sciences] [Google Scholar]
- Ratzenböck, S., Großschedl, J. E., Alves, J., et al. 2023, A&A, 678, A71 [NASA ADS] [CrossRef] [EDP Sciences] [Google Scholar]
- Rieke, G. H., Wright, G., Böker, T., et al. 2015, Publ. Astron. Soc. Pac., 127, 584 [Google Scholar]
- Rigby, J., Perrin, M., McElwain, M., et al. 2023, PASP, 135, 048001 [NASA ADS] [CrossRef] [Google Scholar]
- Rigliaco, E., Pascucci, I., Duchene, G., et al. 2015, ApJ, 801, 31 [Google Scholar]
- Rimmer, P. B., & Helling, C. 2016, ApJS, 224, 9 [NASA ADS] [CrossRef] [Google Scholar]
- Ristić, M., Poparić, G. B., & Belić, D. S. 2007, Chem. Phys., 336, 58 [CrossRef] [Google Scholar]
- Sabotta, S., Schlecker, M., Chaturvedi, P., et al. 2021, A&A, 653, A114 [NASA ADS] [CrossRef] [EDP Sciences] [Google Scholar]
- Schlecker, M., Burn, R., Sabotta, S., et al. 2022, A&A, 664, A180 [NASA ADS] [CrossRef] [EDP Sciences] [Google Scholar]
- Scoville, N. Z., Krotkov, R., & Wang, D. 1980, ApJ, 240, 929 [NASA ADS] [CrossRef] [Google Scholar]
- Sellek, A. D., & van Dishoeck, E. F. 2025, A&A, 701, A239 [NASA ADS] [CrossRef] [EDP Sciences] [Google Scholar]
- Sellek, A. D., Vlasblom, M., & van Dishoeck, E. F. 2025, A&A, 694, A79 [NASA ADS] [CrossRef] [EDP Sciences] [Google Scholar]
- Tabone, B., Bettoni, G., van Dishoeck, E. F., et al. 2023, Nat. Astron., 7, 805 [NASA ADS] [CrossRef] [Google Scholar]
- Thi, W. F., Kamp, I., Woitke, P., et al. 2013, A&A, 551, A49 [NASA ADS] [CrossRef] [EDP Sciences] [Google Scholar]
- van der Tak, F. F. S., Lique, F., Faure, A., Black, J. H., & van Dishoeck, E. F. 2020, Atoms, 8, 15 [Google Scholar]
- Vlasblom, M., van Dishoeck, E. F., Tabone, B., & Bruderer, S. 2024, A&A, 682, A91 [NASA ADS] [CrossRef] [EDP Sciences] [Google Scholar]
- Walsh, C., Nomura, H., & van Dishoeck, E. 2015, A&A, 582, A88 [NASA ADS] [CrossRef] [EDP Sciences] [Google Scholar]
- Wei, C.-E., Nomura, H., Lee, J.-E., et al. 2019, ApJ, 870, 129 [NASA ADS] [CrossRef] [Google Scholar]
- Wells, M., Pel, J. W., Glasse, A., et al. 2015, PASP, 127, 646 [NASA ADS] [CrossRef] [Google Scholar]
- Woitke, P., Kamp, I., & Thi, W. F. 2009, A&A, 501, 383 [NASA ADS] [CrossRef] [EDP Sciences] [Google Scholar]
- Woitke, P., Min, M., Pinte, C., et al. 2016, A&A, 586, A103 [NASA ADS] [CrossRef] [EDP Sciences] [Google Scholar]
- Woitke, P., Min, M., Thi, W. F., et al. 2018, A&A, 618, A57 [NASA ADS] [CrossRef] [EDP Sciences] [Google Scholar]
- Woitke, P., Thi, W. F., Arabhavi, A. M., et al. 2024, A&A, 683, A219 [NASA ADS] [CrossRef] [EDP Sciences] [Google Scholar]
- Wright, G. S., Wright, D., Goodson, G. B., et al. 2015, PASP, 127, 595 [NASA ADS] [CrossRef] [Google Scholar]
- Wright, G. S., Rieke, G. H., Glasse, A., et al. 2023, PASP, 135, 048003 [NASA ADS] [CrossRef] [Google Scholar]
- Xie, C., Pascucci, I., Long, F., et al. 2023, ApJ, 959, L25 [NASA ADS] [CrossRef] [Google Scholar]
- Yang, B., Stancil, P. C., Balakrishnan, N., & Forrey, R. C. 2010, ApJ, 718, 1062 [Google Scholar]
- Yang, H., Herczeg, G. J., Linsky, J. L., et al. 2012, ApJ, 744, 121 [NASA ADS] [CrossRef] [Google Scholar]
Appendix A Best model disk structure
Figure A.1 shows the thermal structure, gas density and UV radiation field in the best model. The dust emission at 10 and 13.7 µm originating from deeper in the disk are also shown in green and grey. The disk is vertically optically thin due to the presence of large grains. The radial Av of 1 mag is shown in black.
The SED from the best-fit model along with the photometeric observations are shown in the Fig. A.2. There is only an upper limit on the flux at long wavelengths obtained from Barenfeld et al. (2016) as this source was not detected with ALMA.
Appendix B Abundance of molecules
Figure B.1 show the abundances of various molecules that are either detected or are used as a tool to determine the disk properties in this analysis. The inner disk has a high C/O ratio and thus is the reservoir of the hydrocarbons. The outer disk serves as an oxygen rich environment and molecules such as H2O and CO2 reside in the outer disk
Appendix C C2H2 line analysis
Figure C.1 shows the emitting regions of two different lines in the Q- and R-branch spectral region. We find that the average temperature weighted with the abundance of C2H2 in the emitting region of the R-branch is higher (493.22 K) than that of the Q-branch (455.58 K). This is because of the extended emitting region of the R-branch.
On changing the LUV, the temperatures of the regions probed by the P- and R-branch change very little. The average gas temperature weighted by the abundance of C2H2 for the R-branch in the model with an fUV of 0.008 decreases by ∼7% relative to the final model, whereas for the Q-branch it decreases by ∼18%. This shows that the effect of the LUV on the gas temperature is more severe in the surface layers.
Appendix D Converging to the best model
We explored a range of disk parameters to identify a model that best reproduces the observed spectral features. In particular, we tested multiple approaches to simultaneously reproduce the C2H2 and CO2 emission features. Here, we present a selection of intermediate models considered during the process of converging on the final adopted model. A continuous disk structure is modelled using C/O = 100 and a gas-to-dust mass ratio of 1000 along with dust settling. The modelled spectrum of CO and CO2 produced by FLiTs, convolved to a spectral resolution of 3500 and 2500, respectively, and resampled to JWST-MIRI/MRS wavelength grid resolution is shown in Fig. D.1. The flux levels of CO2 are too low to be detected by JWST-MIRI. The CO flux is higher than our best-fit model even when we apply a huge oxygen depletion (C/O = 100). This indicates the need of a gap to produce more CO2 flux and reduce the CO flux.
Figure D.2 shows the molecular emission from CO and CO2 when there is a gap present in the disk. The inner disk has the parameters of the best model. The outer disk has a C/O ratio of 10. The modelled CO2 fluxes strongly underpredict the observations. This shows that an oxygen reservoir is required to generate detectable CO2 emission.
Figure D.3 illustrates the emitting area of different species in the model where all the parameters match the best model except for the C/O ratio in the outer disk. When the C/O ratio in the outer disk is higher than 0.1 (extremely O-rich, such as 0.05), CO emits from the outer disk irrespective of the location of the gap.
Appendix E Trends
Figure E.1 depicts the change in spectrum of CO when C/O ratio is enhanced either by depleting oxygen or enriching carbon in the gas in the disk. Figure E.2 depicts the change in spectrum of C2H2 when C/O ratio of 1 is attained by depleting oxygen and enriching carbon. Figure E.3 shows the modelled CO flux at NIRSpec wavelength region convolved to a resolution of 2700. We did not consider here the isotopologues such as 13CO, C18O and C17O.
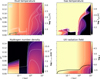 |
Fig. A.1 Two-dimensional gas temperature, dust temperature, gas density, and the UV radiation field structure in the best fit model. The white solid contours correspond to the gas temperature of 330 and 650 K. The grey and green contours represent where the dust emission at 13.7 and 10 µm is coming from. The black contour corresponds to the radial Av of 1 mag. The white dashed contours correspond to the value of the ticks on the colour bar. |
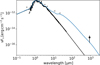 |
Fig. A.2 Spectral energy distribution of the final model in together with the photometric observations (black dots). The black line denotes the stellar contribution to the SED. |
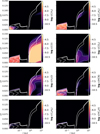 |
Fig. B.1 Abundances of different molecules in the best model. The solid white contours correspond to maximum and minimum temperatures 330 and 650 K retrieved from slab model fitting in Tabone et al. (2023). The dotted contours correspond to the value of the ticks on the colour bar. |
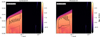 |
Fig. C.1 Abundance of C2H2 in the best model with the emitting area (solid black line) of a single strong molecular line from the Q- and R-branch spectral region of C2H2. The black dashed contours denote the dust emission at that wavelength. |
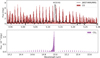 |
Fig. D.1 Molecular emission of CO and CO2 from the model with a continuous disk structure convolved and resampled to JWST-MIRI/MRS resolution. The JWST-MIRI/MRS spectrum is shown in black. |
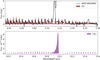 |
Fig. D.2 Molecular emission of CO and CO2 from the model with a gap in the disk structure (C/O=100 in the inner and 10 in the outer disk) convolved and resampled to JWST-MIRI/MRS resolution. The JWST-MIRI/MRS spectrum is shown in black. |
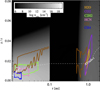 |
Fig. D.3 Emitting area of different molecules in the model when the C/O ratio is 0.05 in the outer disk. Contours are similar to Fig. 4. |
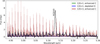 |
Fig. E.1 Molecular flux of CO in models with a C/O ratio of 1 and 3 attained by enriching carbon and a C/O ratio of 1 attained by depleting oxygen. |
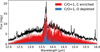 |
Fig. E.2 Molecular flux of C2H2 in models with a C/O ratio of 1 attained by enriching carbon and by depleting oxygen. |
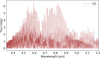 |
Fig. E.3 Emission of 12CO convolved to a resolution of 2700 from the best model. |
 |
Fig. E.4 Spectrum of C2H2 and HCN together considering opacity overlap on top of the observed JWST-MIRI/MRS spectrum in black. |
All Tables
Characteristics of the emitting region of various molecules in the best disk model.
All Figures
|
Fig. 1 Full disk gas and dust surface density profile in the best model. |
| In the text | |
|
Fig. 2 Illustration showing the best disk model along with the assumed C/O ratio and gas-to-dust mass ratio in the disk. The corresponding gas mass of the two zones are shown. |
| In the text | |
|
Fig. 3 Modelled spectrum of the best disk model convolved and resampled to the JWST-MIRI/MRS resolution and compared to the continuum subtracted observed spectrum. Tabone et al. (2023, Extended Data Figure 5) provide two different continua, and therefore, we used the continuum from their middle panel to depict C2H2 and CH4, whereas the continuum from their bottom panel is used to depict the rest of the molecules. The solid black line depicts the region where the modelled fluxes approximately match the observations. These are the regions where little effect from blending is expected. |
| In the text | |
|
Fig. 4 Emitting region (4.89–19 µm) of different molecules in the model. The dashed contour corresponds to the radial Av of 1 mag. The disk model is optically thin in the vertical direction. |
| In the text | |
|
Fig. 5 Zoom-in of JWST/MIRI MRS spectrum (black) showing CO emission. The emission of CO from the best thermo-chemical model convolved to 3500 and resampled to JWST-MIRI/MRS resolution is shown in brown. The H I 10-6 line is marked in grey. |
| In the text | |
|
Fig. 6 Top panel: modelled flux of C2H2 using FLiTs. Bottom panel: modelled flux of C2H2 and CH4 together using FLiTs. The grey dashed line depicts where the ’dip’ in the observed spectrum occurs. The black dashed line shows the dip in flux in the best modelled spectrum. |
| In the text | |
|
Fig. 7 Effect of the depletion of oxygen to enhance the C/O ratio on the integrated line flux of CO (4.936–5.298 µm), H2O (4.891–18.474 µm), and C2H2 (11.664–17.289 µm). The black horizontal line shows the CO observed integrated flux, with the grey area indicating the error. The blue shaded area shows the H2O upper limit, and the brown line and shaded area show the integrated observed flux of C2H2 and its associated error. The C2H2 flux for the model with a C/O ratio of 0.45 was low (∼6×10⁻¹⁹ Wm−2) and is therefore not shown. The dotted vertical line highlights the model with a typical C/O ratio of 0.45. |
| In the text | |
|
Fig. 8 Effect of the depletion of oxygen and enrichment of carbon to enhance the C/O ratio on the integrated line flux of CO (4.936–5.298 µm) and H2O (4.891–18.474 µm) and C2H2 (11.664–17.289 µm). The circles and triangles represent models where oxygen was depleted and carbon was enriched, respectively, to attain a high C/O elemental ratio. The solid horizontal brown line depicts the integrated C2H2 flux. The solid black line denotes the integrated observed line flux of CO, and the dotted vertical line shows the model with a typical C/O ratio of 0.45 similar to Fig. 7. |
| In the text | |
|
Fig. 9 Model of the 0D slab fit to the 2D modelled spectrum of C2H2, which has been convolved to a resolution of 2500 and resampled to JWST-MIRI/MRS. The light red and dark red colors depict the optically thin and thick component, respectively. |
| In the text | |
|
Fig. 10 Effect of UV luminosity, LUV, (upper panel) and C/O ratio (lower panel) on the C2H2 emission band at 13.5 µm. The parameter fUV denotes the ratio between LUV and L⋆. All models in the lower panel correspond to an fUV value of 0.026. |
| In the text | |
|
Fig. A.1 Two-dimensional gas temperature, dust temperature, gas density, and the UV radiation field structure in the best fit model. The white solid contours correspond to the gas temperature of 330 and 650 K. The grey and green contours represent where the dust emission at 13.7 and 10 µm is coming from. The black contour corresponds to the radial Av of 1 mag. The white dashed contours correspond to the value of the ticks on the colour bar. |
| In the text | |
|
Fig. A.2 Spectral energy distribution of the final model in together with the photometric observations (black dots). The black line denotes the stellar contribution to the SED. |
| In the text | |
|
Fig. B.1 Abundances of different molecules in the best model. The solid white contours correspond to maximum and minimum temperatures 330 and 650 K retrieved from slab model fitting in Tabone et al. (2023). The dotted contours correspond to the value of the ticks on the colour bar. |
| In the text | |
|
Fig. C.1 Abundance of C2H2 in the best model with the emitting area (solid black line) of a single strong molecular line from the Q- and R-branch spectral region of C2H2. The black dashed contours denote the dust emission at that wavelength. |
| In the text | |
|
Fig. D.1 Molecular emission of CO and CO2 from the model with a continuous disk structure convolved and resampled to JWST-MIRI/MRS resolution. The JWST-MIRI/MRS spectrum is shown in black. |
| In the text | |
|
Fig. D.2 Molecular emission of CO and CO2 from the model with a gap in the disk structure (C/O=100 in the inner and 10 in the outer disk) convolved and resampled to JWST-MIRI/MRS resolution. The JWST-MIRI/MRS spectrum is shown in black. |
| In the text | |
|
Fig. D.3 Emitting area of different molecules in the model when the C/O ratio is 0.05 in the outer disk. Contours are similar to Fig. 4. |
| In the text | |
|
Fig. E.1 Molecular flux of CO in models with a C/O ratio of 1 and 3 attained by enriching carbon and a C/O ratio of 1 attained by depleting oxygen. |
| In the text | |
|
Fig. E.2 Molecular flux of C2H2 in models with a C/O ratio of 1 attained by enriching carbon and by depleting oxygen. |
| In the text | |
|
Fig. E.3 Emission of 12CO convolved to a resolution of 2700 from the best model. |
| In the text | |
|
Fig. E.4 Spectrum of C2H2 and HCN together considering opacity overlap on top of the observed JWST-MIRI/MRS spectrum in black. |
| In the text | |
Current usage metrics show cumulative count of Article Views (full-text article views including HTML views, PDF and ePub downloads, according to the available data) and Abstracts Views on Vision4Press platform.
Data correspond to usage on the plateform after 2015. The current usage metrics is available 48-96 hours after online publication and is updated daily on week days.
Initial download of the metrics may take a while.