Open Access
Fig. B.1
Download original image
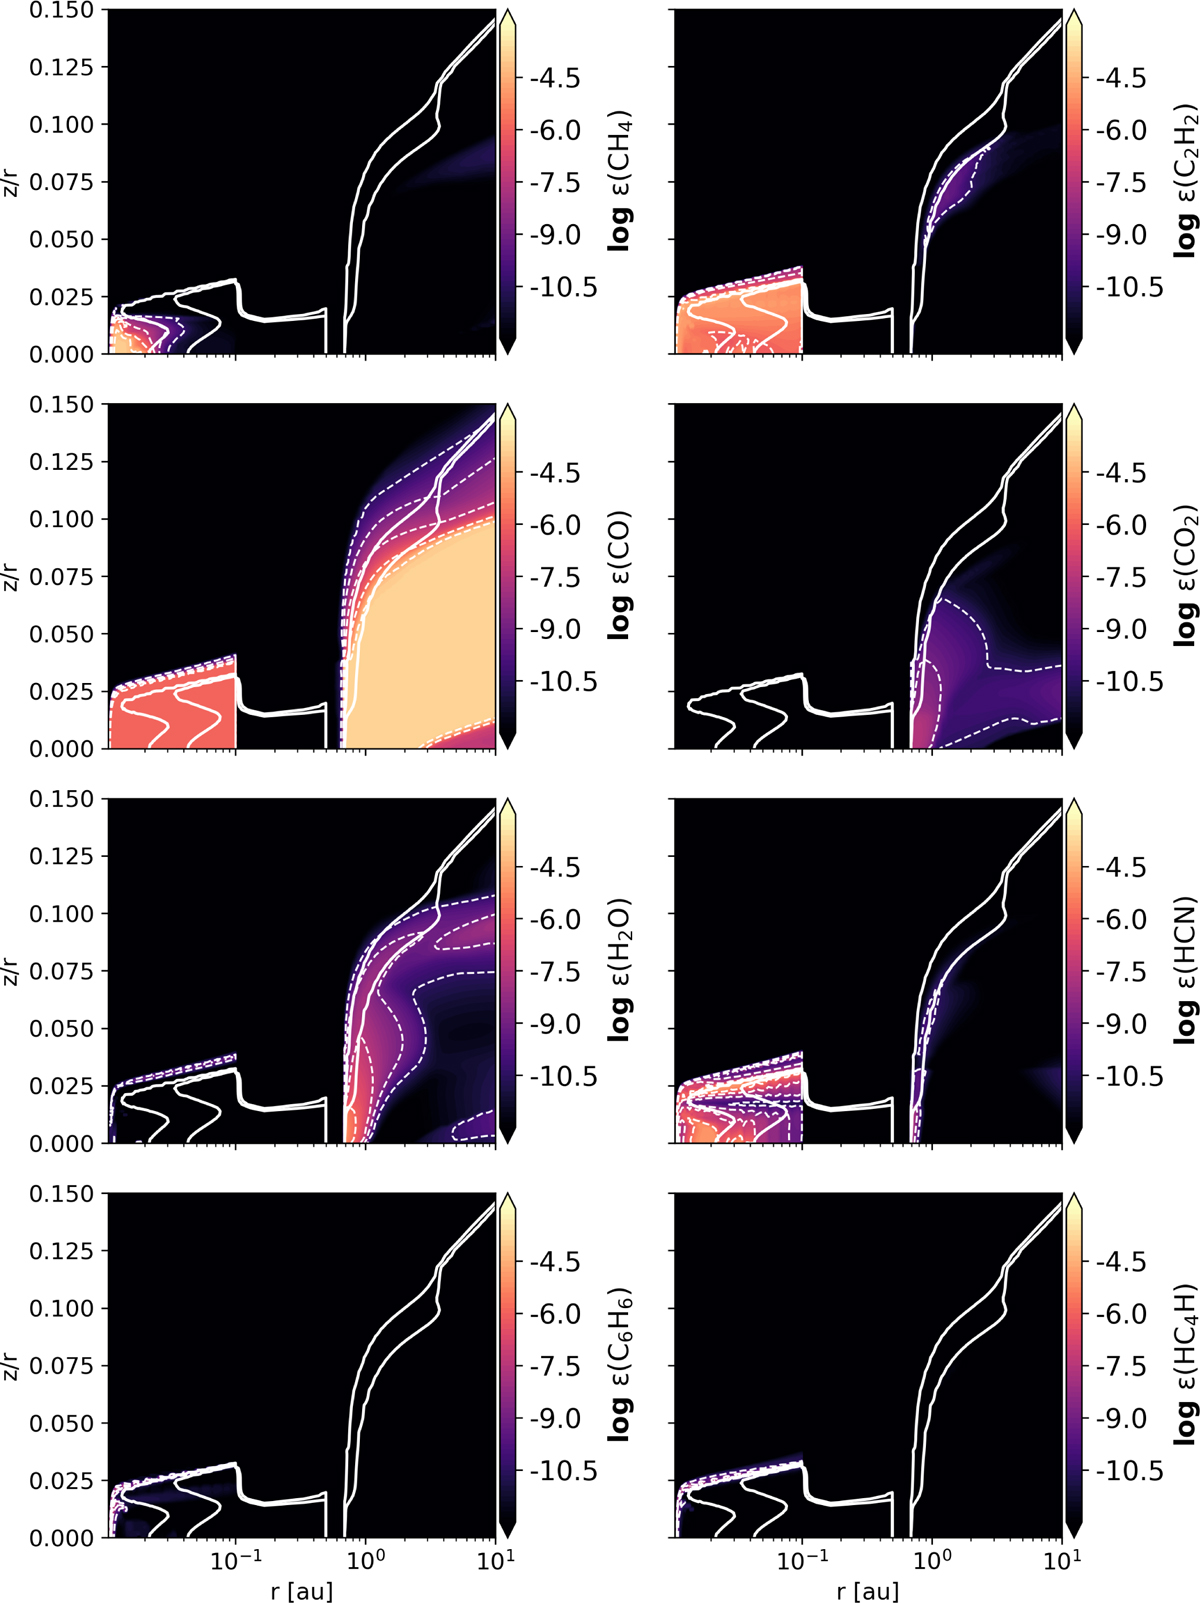
Abundances of different molecules in the best model. The solid white contours correspond to maximum and minimum temperatures 330 and 650 K retrieved from slab model fitting in Tabone et al. (2023). The dotted contours correspond to the value of the ticks on the colour bar.
Current usage metrics show cumulative count of Article Views (full-text article views including HTML views, PDF and ePub downloads, according to the available data) and Abstracts Views on Vision4Press platform.
Data correspond to usage on the plateform after 2015. The current usage metrics is available 48-96 hours after online publication and is updated daily on week days.
Initial download of the metrics may take a while.