Open Access
Fig. C.1
Download original image
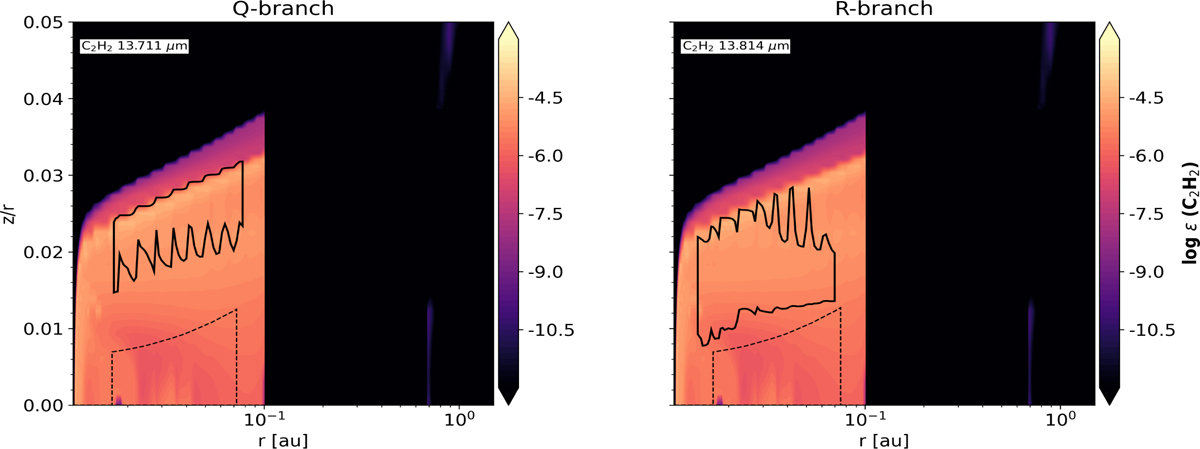
Abundance of C2H2 in the best model with the emitting area (solid black line) of a single strong molecular line from the Q- and R-branch spectral region of C2H2. The black dashed contours denote the dust emission at that wavelength.
Current usage metrics show cumulative count of Article Views (full-text article views including HTML views, PDF and ePub downloads, according to the available data) and Abstracts Views on Vision4Press platform.
Data correspond to usage on the plateform after 2015. The current usage metrics is available 48-96 hours after online publication and is updated daily on week days.
Initial download of the metrics may take a while.