Fig. 3
Download original image
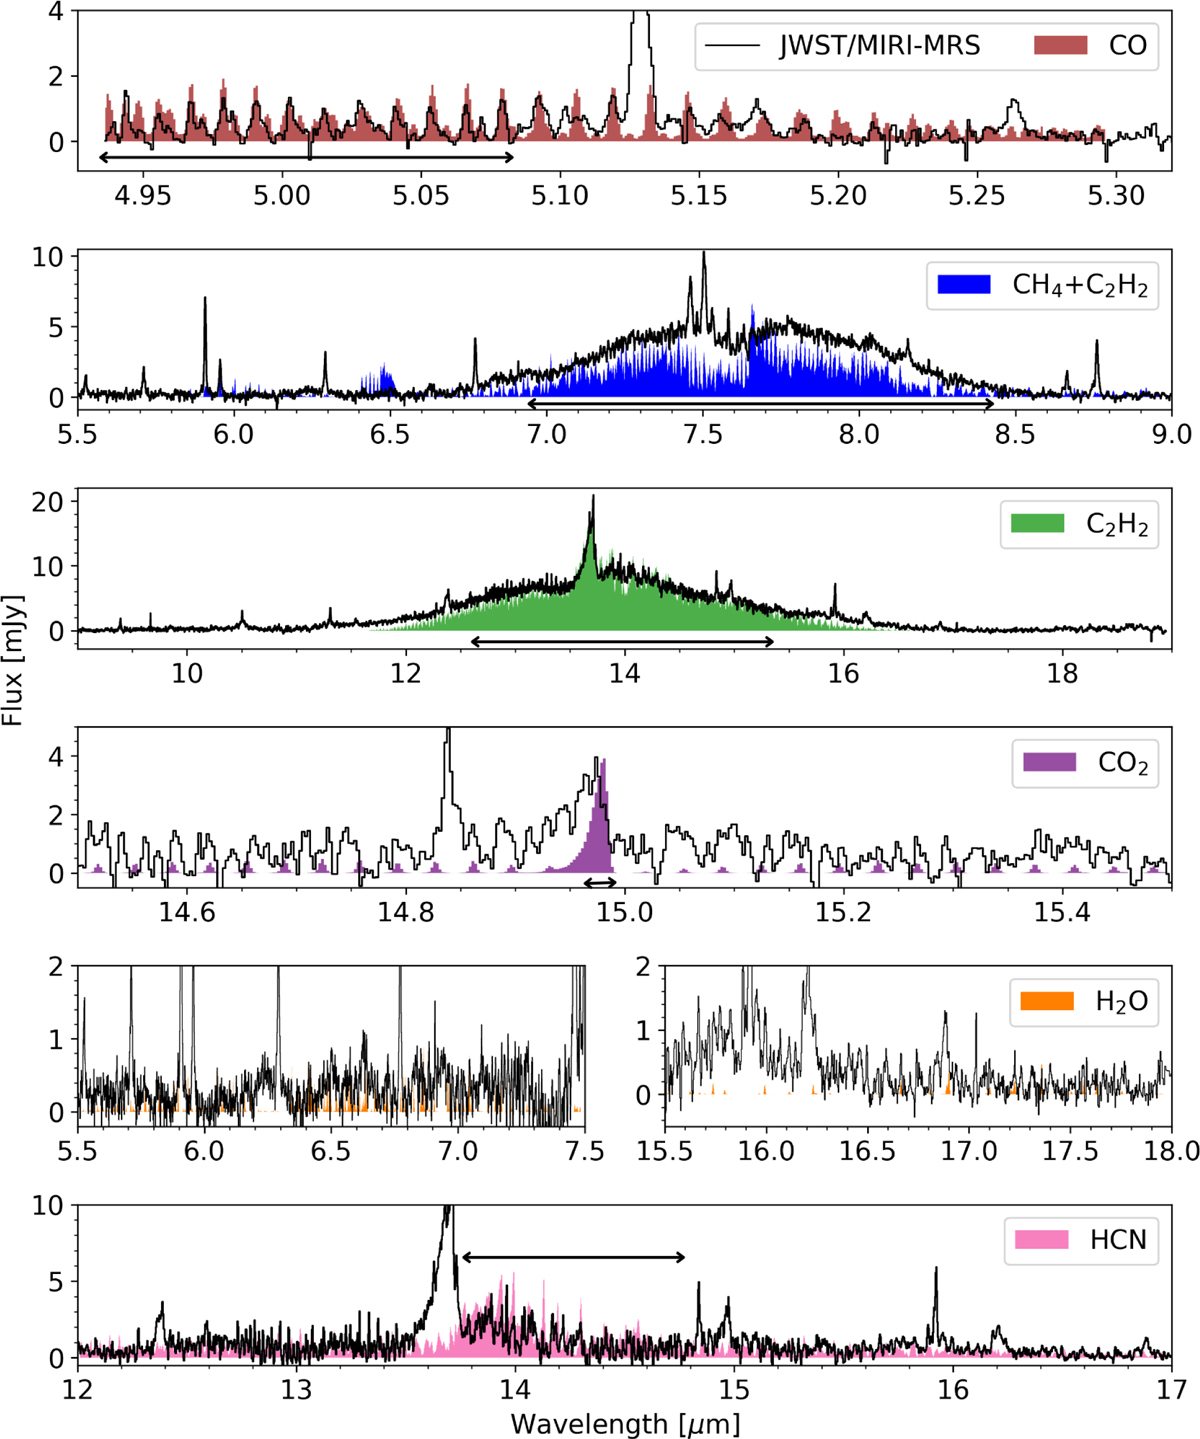
Modelled spectrum of the best disk model convolved and resampled to the JWST-MIRI/MRS resolution and compared to the continuum subtracted observed spectrum. Tabone et al. (2023, Extended Data Figure 5) provide two different continua, and therefore, we used the continuum from their middle panel to depict C2H2 and CH4, whereas the continuum from their bottom panel is used to depict the rest of the molecules. The solid black line depicts the region where the modelled fluxes approximately match the observations. These are the regions where little effect from blending is expected.
Current usage metrics show cumulative count of Article Views (full-text article views including HTML views, PDF and ePub downloads, according to the available data) and Abstracts Views on Vision4Press platform.
Data correspond to usage on the plateform after 2015. The current usage metrics is available 48-96 hours after online publication and is updated daily on week days.
Initial download of the metrics may take a while.