Fig. 8
Download original image
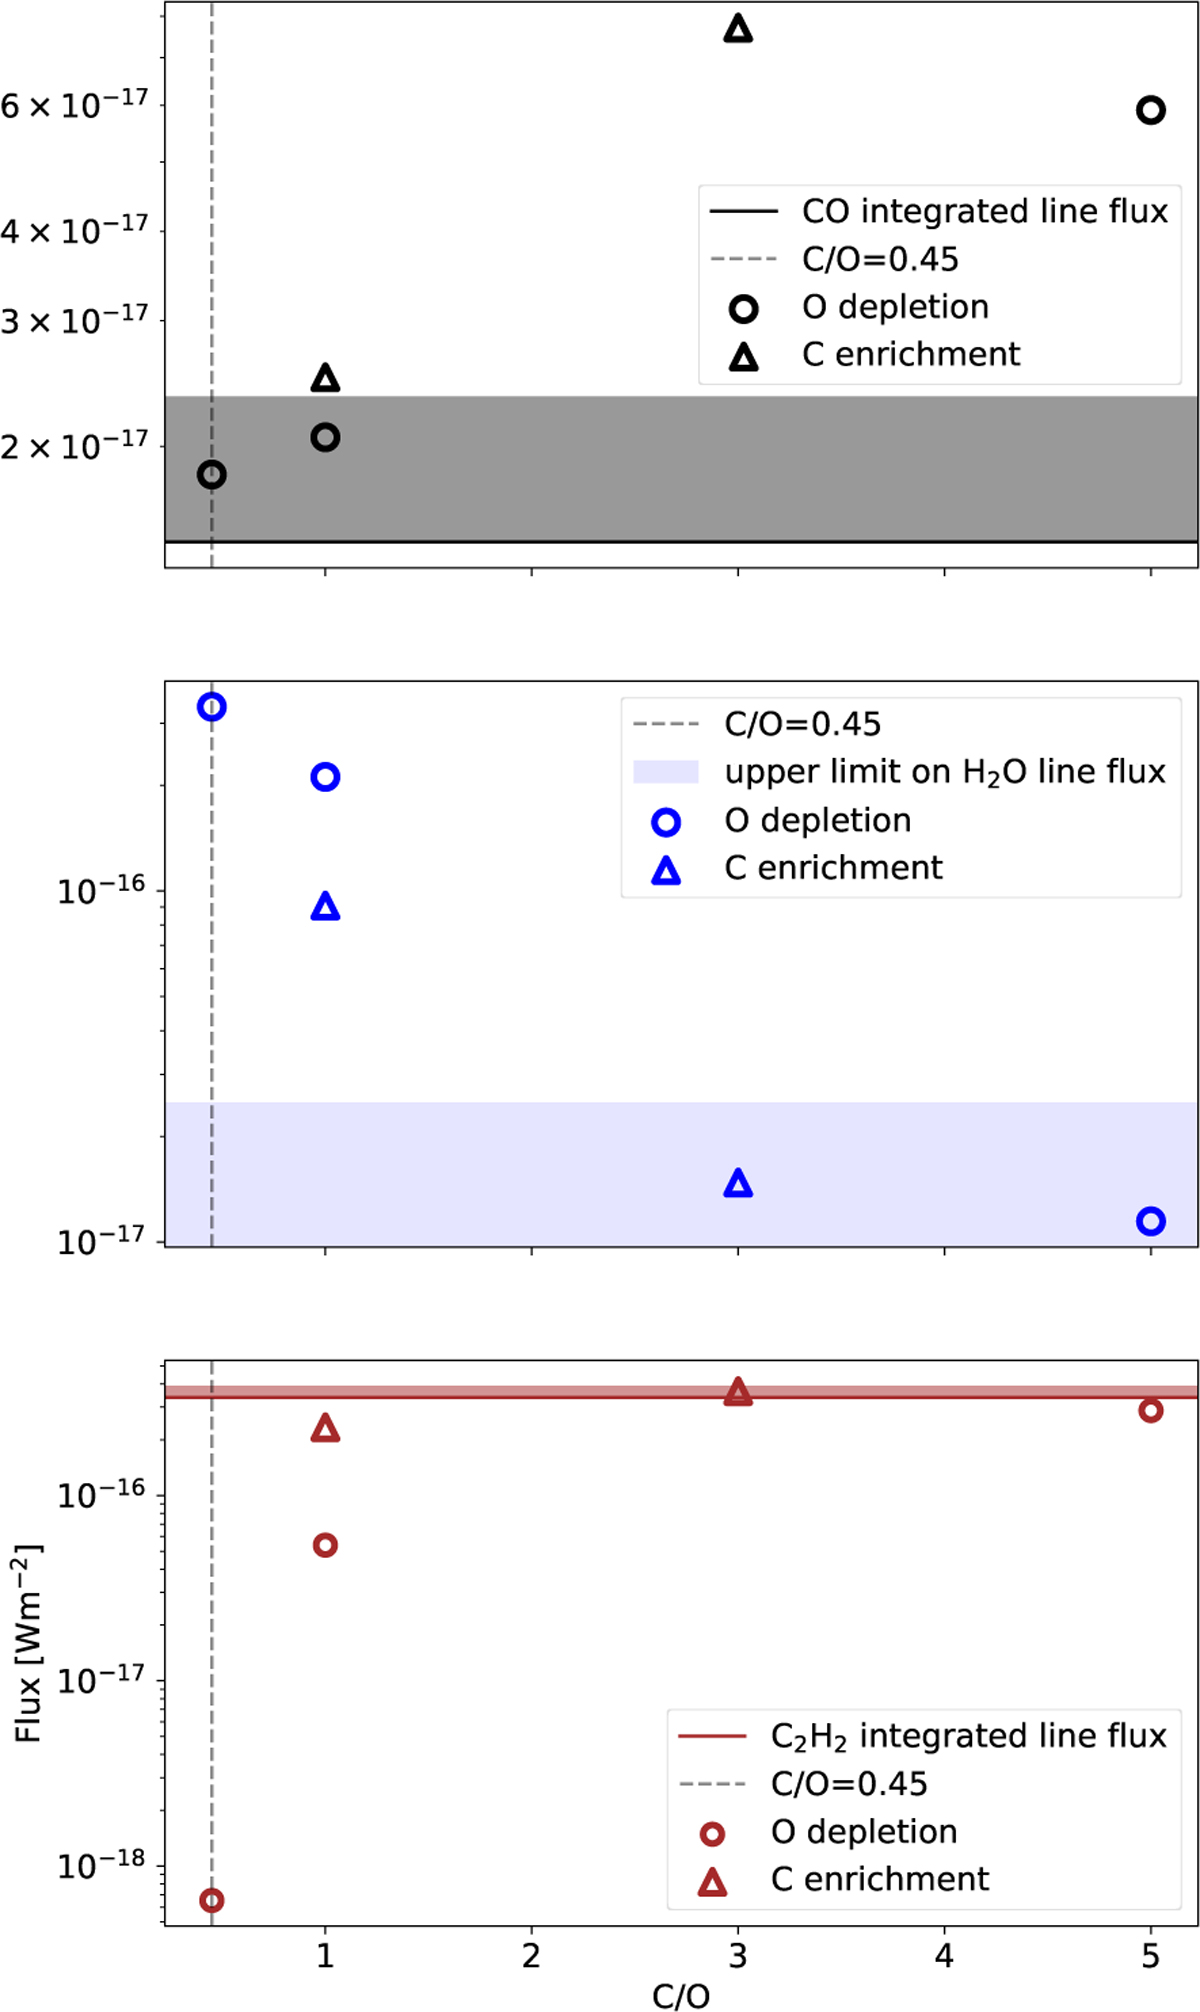
Effect of the depletion of oxygen and enrichment of carbon to enhance the C/O ratio on the integrated line flux of CO (4.936–5.298 µm) and H2O (4.891–18.474 µm) and C2H2 (11.664–17.289 µm). The circles and triangles represent models where oxygen was depleted and carbon was enriched, respectively, to attain a high C/O elemental ratio. The solid horizontal brown line depicts the integrated C2H2 flux. The solid black line denotes the integrated observed line flux of CO, and the dotted vertical line shows the model with a typical C/O ratio of 0.45 similar to Fig. 7.
Current usage metrics show cumulative count of Article Views (full-text article views including HTML views, PDF and ePub downloads, according to the available data) and Abstracts Views on Vision4Press platform.
Data correspond to usage on the plateform after 2015. The current usage metrics is available 48-96 hours after online publication and is updated daily on week days.
Initial download of the metrics may take a while.