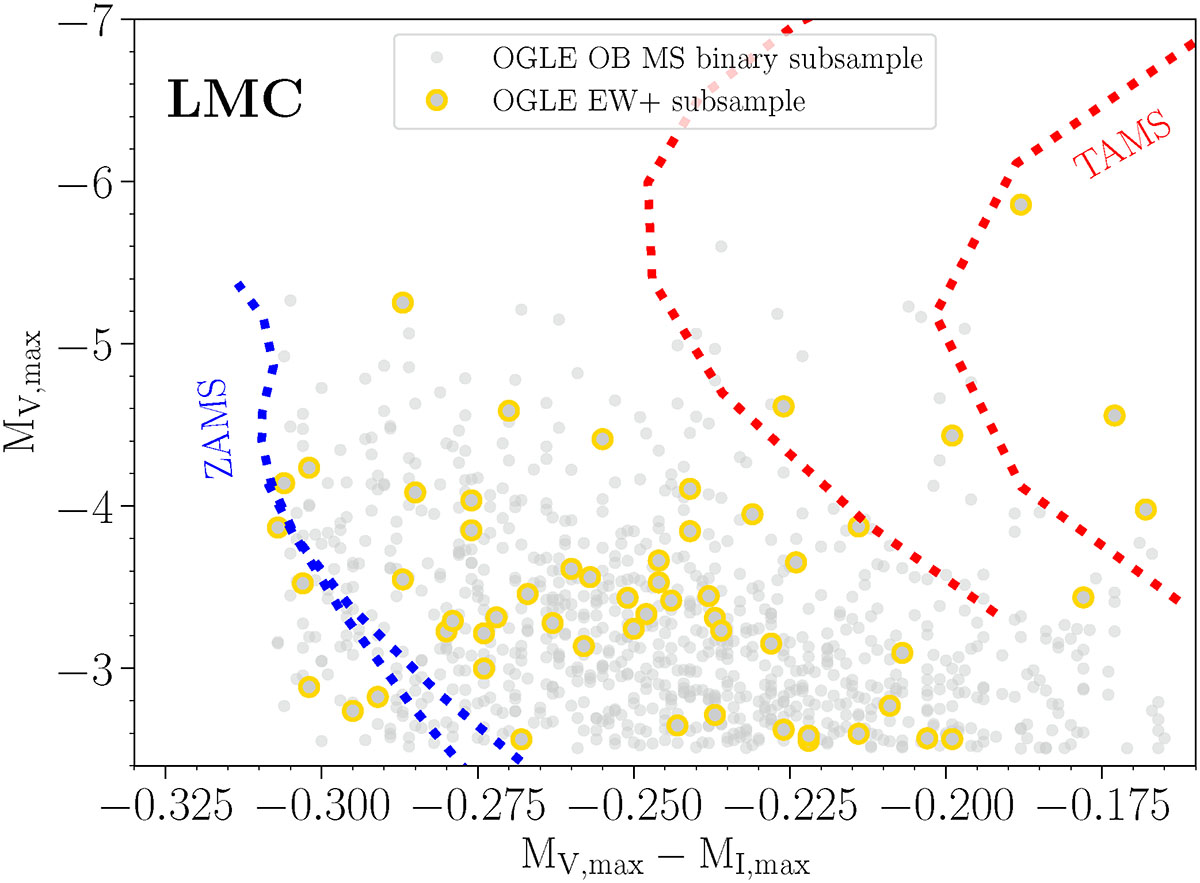
Fig. 1.
Download original image
OB binaries with periods P ≤ 3 days across all morph parameter values (from 0 to 1), identified as MS systems from the OGLE sample (light grey dots) on the absolute color (MV, max − MI, max) – magnitude (MV, max) space (where, the absolute magnitudes correspond to their values at maximum brightness of the binary). Overlaid are the empirically identified OGLE EW+ subsample from the LMC (yellow circles, as described in Section 2.2). Curves indicate the limits of the ZAMS and TAMS curves computed from non-rotating and rotating (vi = 330 km/s) models of single stars with masses of 7 − 50 M⊙.
Current usage metrics show cumulative count of Article Views (full-text article views including HTML views, PDF and ePub downloads, according to the available data) and Abstracts Views on Vision4Press platform.
Data correspond to usage on the plateform after 2015. The current usage metrics is available 48-96 hours after online publication and is updated daily on week days.
Initial download of the metrics may take a while.