Fig. 5.
Download original image
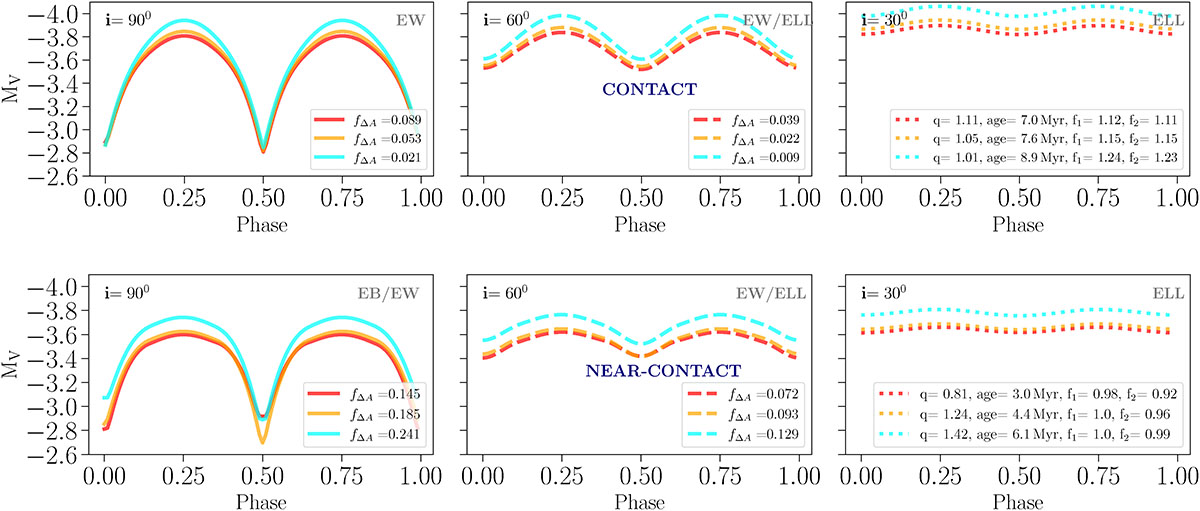
Light curves computed for System 2 at the various evolutionary points marked in Fig. 4, at inclinations of i = 30°, 60° and 90°. Top panel: Light curves from the contact phase (green region in Fig. 4), where the cyan light curve represents the dominant type of CB expected from models, i.e., one which has acquired temperature equalization. Bottom panel: Light curves during the near-contact phase CB (pink striped region in Fig. 4), which is further split as a semi-detached (red and orange light curves) and detached system (cyan light curve). Also labeled are the relative eclipse depths, fΔA, except for ELL binaries, which have an fΔA of the order of 0.001.
Current usage metrics show cumulative count of Article Views (full-text article views including HTML views, PDF and ePub downloads, according to the available data) and Abstracts Views on Vision4Press platform.
Data correspond to usage on the plateform after 2015. The current usage metrics is available 48-96 hours after online publication and is updated daily on week days.
Initial download of the metrics may take a while.