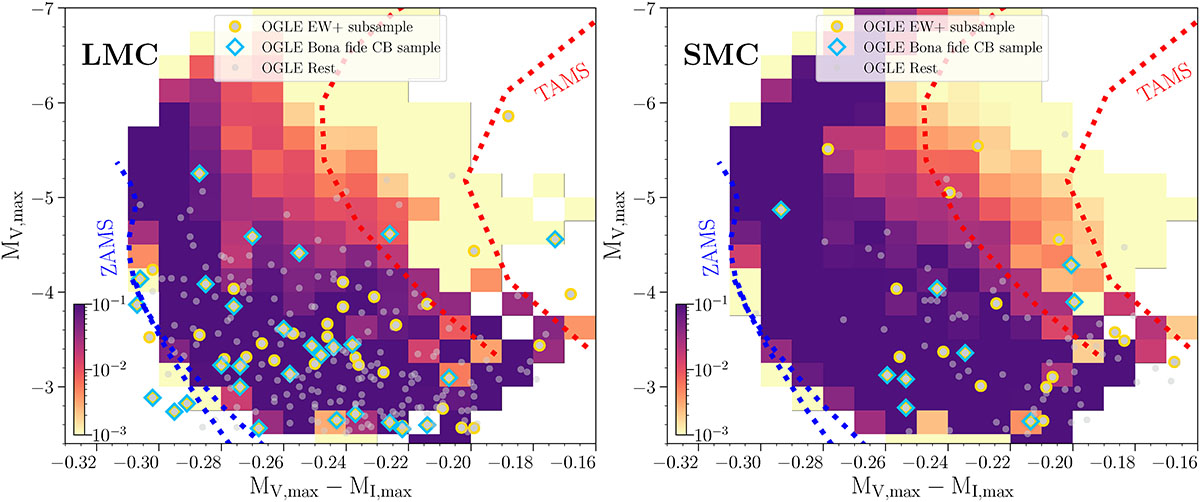
Fig. 6.
Download original image
Heat map showing the probabilistic distribution of the absolute color (MV, max − MI, max) and magnitude (MV, max) at the maximum brightness (i.e., the sum of intrinsic luminosities of both components) of CBs for the LMC and SMC. The OGLE data are marked as follows: OGLE bona fide CB sample (blue diamonds), OGLE EW+ subsample (yellow circles) and OGLE Rest (grey dots), which is the sample with morph parameter c > 0.7 and P ≤ 3 days that did not make the cut into either the EW+ nor the bona fide CB sample. For reference, the theoretical ZAMS and TAMS curves from Fig. 1 are also marked.
Current usage metrics show cumulative count of Article Views (full-text article views including HTML views, PDF and ePub downloads, according to the available data) and Abstracts Views on Vision4Press platform.
Data correspond to usage on the plateform after 2015. The current usage metrics is available 48-96 hours after online publication and is updated daily on week days.
Initial download of the metrics may take a while.