Fig. 4.
Download original image
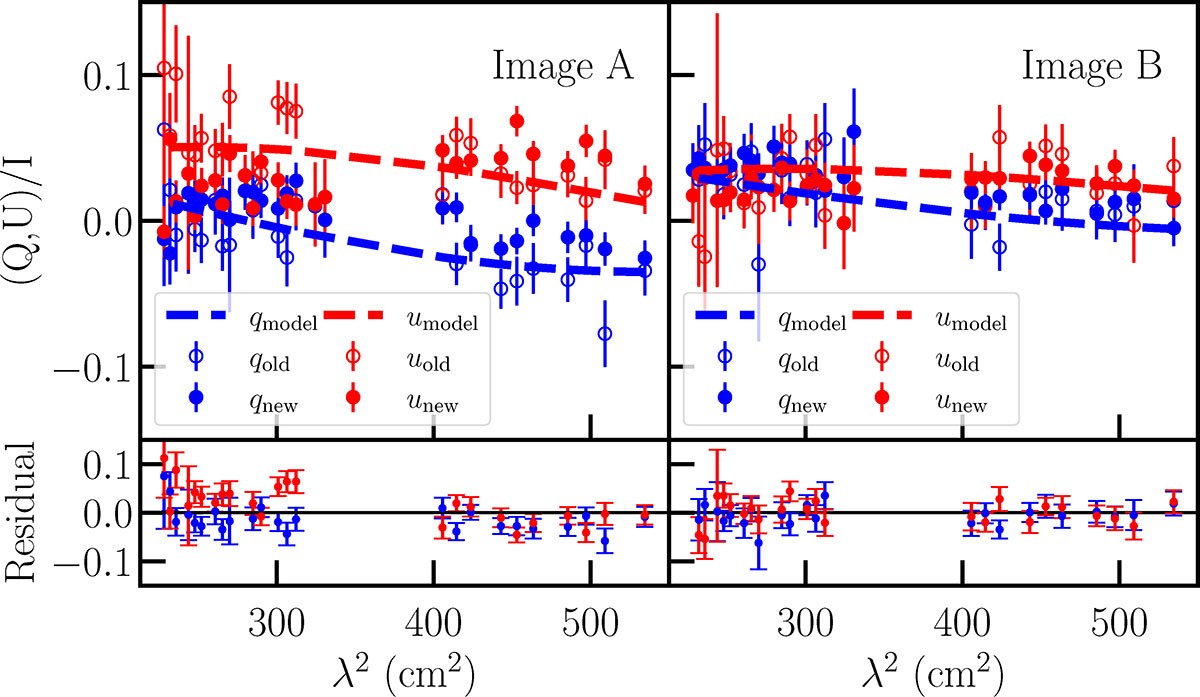
Comparison of our original and our follow-up data in L band. The top row shows Stokes Q/I (blue) and Stokes U/I (red) of our earlier data (empty circles) and our new data (filled circles) as a function of λ2 for image A (left) and image B (right). We also plot the QU fitting model (dashed lines) derived from the full frequency range of the earlier data. The bottom row shows the residual between the two datasets (qold − qnew, uold − unew).
Current usage metrics show cumulative count of Article Views (full-text article views including HTML views, PDF and ePub downloads, according to the available data) and Abstracts Views on Vision4Press platform.
Data correspond to usage on the plateform after 2015. The current usage metrics is available 48-96 hours after online publication and is updated daily on week days.
Initial download of the metrics may take a while.