Fig. 1.
Download original image
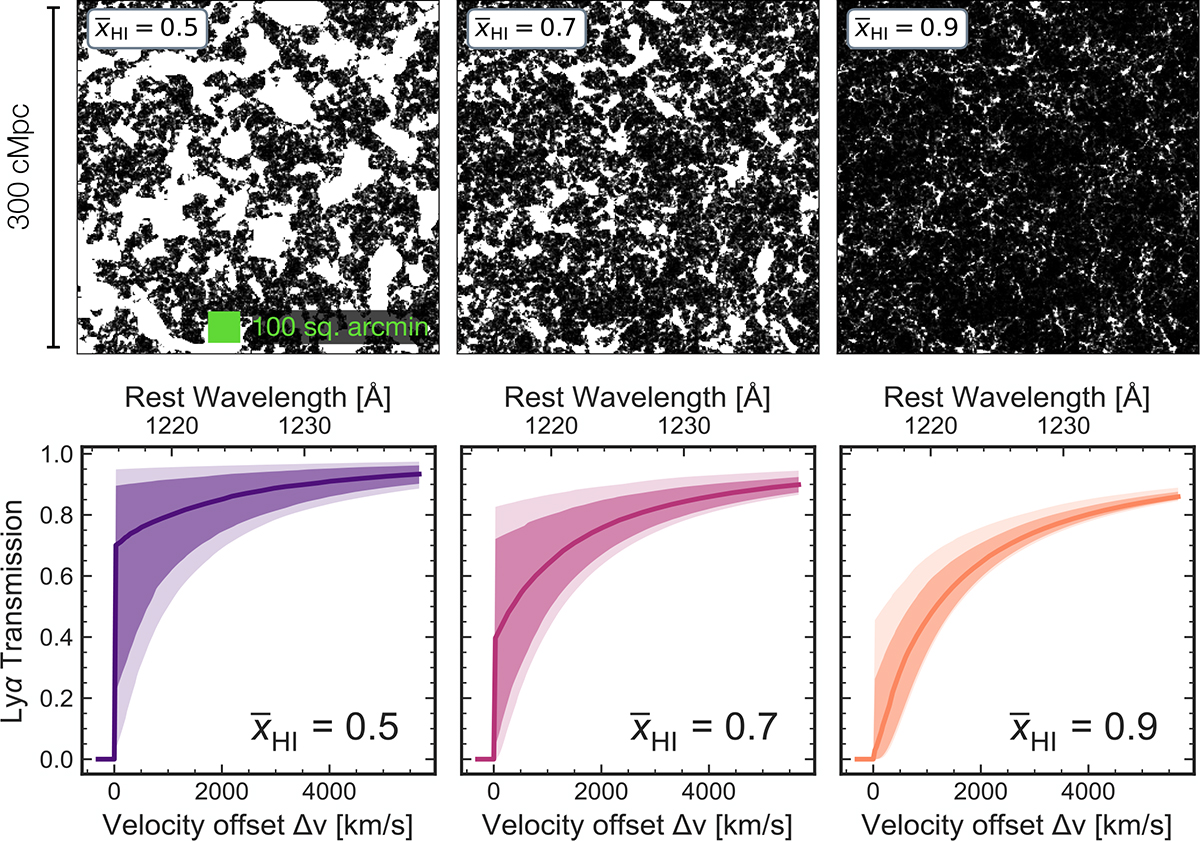
Top panels: Example 300 cMpc × 300 cMpc slices of the ionization field (white patches show ionized gas, black neutral gas) in our (1.6 cGpc)3 simulations at ![]() at z = 8, as described in Section 2.1.1. We show a 100 sq. arcmin field as a green square (similar to e.g. the CEERS and JADES survey coverage) for comparison. Bottom panels: Lyα transmission profiles, due to the optical depth from the IGM, to galaxies in the corresponding simulations. We truncate the transmission blueward of Lyα to account for residual neutral gas inside ionized regions (Mason & Gronke 2020). We show the median (solid line), 68%, and 95% range (shaded regions) of transmission profiles from sightlines to ∼2000 galaxies in the simulations with MUV ∼ −19. When
at z = 8, as described in Section 2.1.1. We show a 100 sq. arcmin field as a green square (similar to e.g. the CEERS and JADES survey coverage) for comparison. Bottom panels: Lyα transmission profiles, due to the optical depth from the IGM, to galaxies in the corresponding simulations. We truncate the transmission blueward of Lyα to account for residual neutral gas inside ionized regions (Mason & Gronke 2020). We show the median (solid line), 68%, and 95% range (shaded regions) of transmission profiles from sightlines to ∼2000 galaxies in the simulations with MUV ∼ −19. When ![]() the sightline variance in the IGM is significant, meaning a large number of sightlines are required to accurately estimate
the sightline variance in the IGM is significant, meaning a large number of sightlines are required to accurately estimate ![]() (see Section 6).
(see Section 6).
Current usage metrics show cumulative count of Article Views (full-text article views including HTML views, PDF and ePub downloads, according to the available data) and Abstracts Views on Vision4Press platform.
Data correspond to usage on the plateform after 2015. The current usage metrics is available 48-96 hours after online publication and is updated daily on week days.
Initial download of the metrics may take a while.