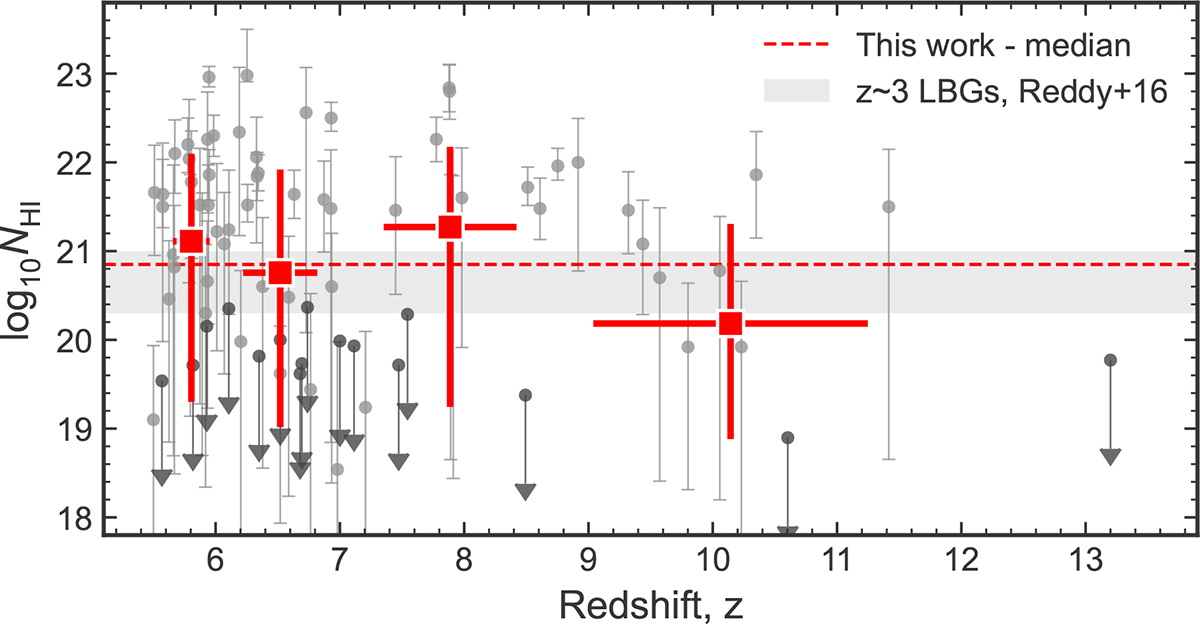
Fig. 11.
Download original image
Inferred local HI column density as a function of redshift. Grey points show the median and 68% range inferred from fits to individual spectra. Red markers show the median and 68% range in four redshift bins. The grey shaded region shows the range of NH I estimated in median stacked spectra of ∼1000 z ∼ 3 LBGs by Reddy et al. (2016).
Current usage metrics show cumulative count of Article Views (full-text article views including HTML views, PDF and ePub downloads, according to the available data) and Abstracts Views on Vision4Press platform.
Data correspond to usage on the plateform after 2015. The current usage metrics is available 48-96 hours after online publication and is updated daily on week days.
Initial download of the metrics may take a while.