Fig. 13.
Download original image
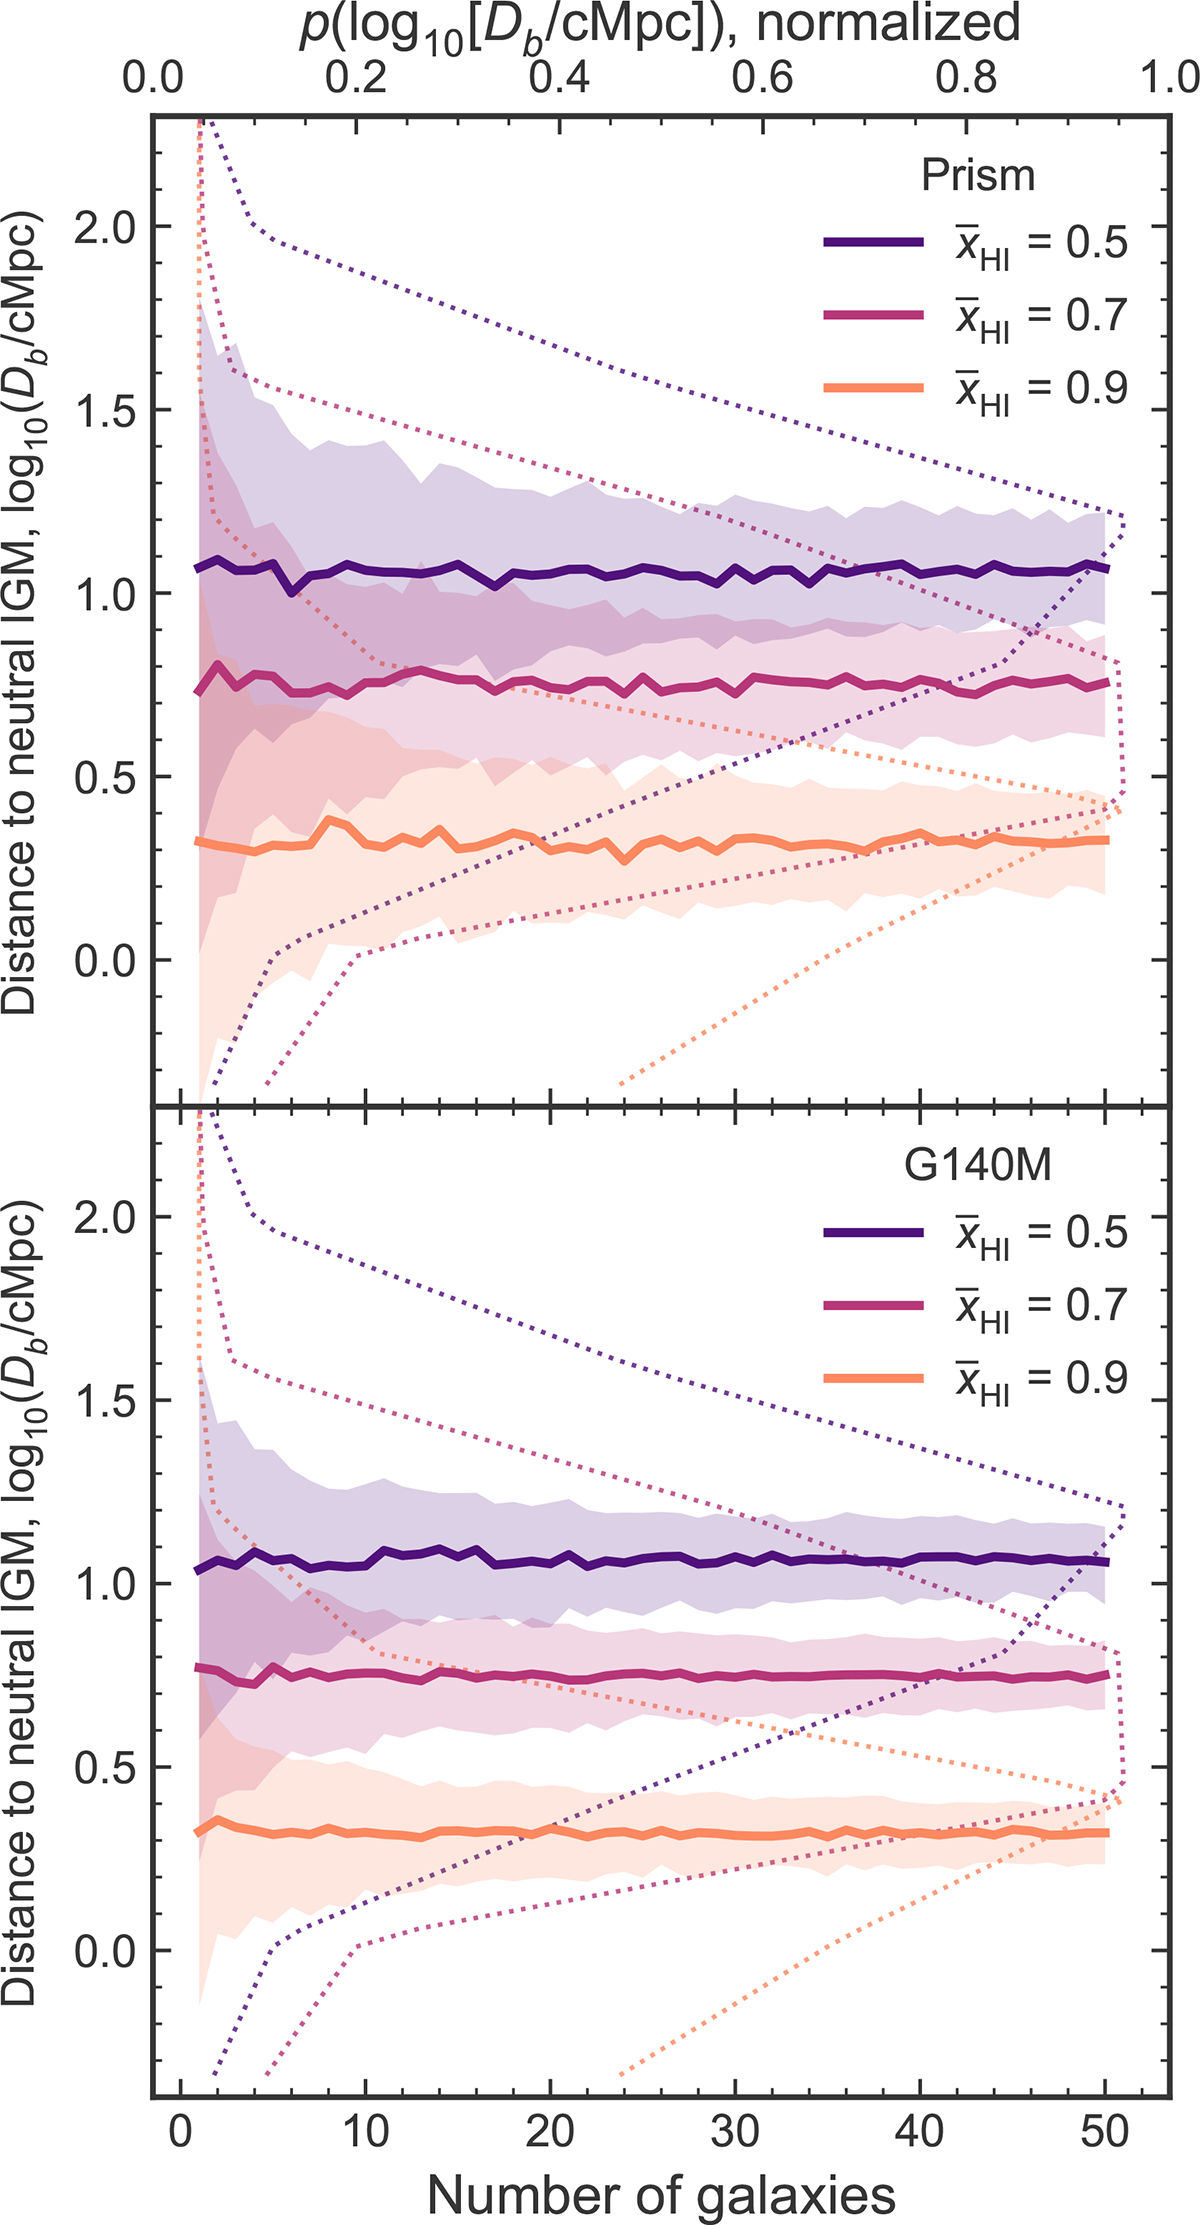
Forecasted number of galaxies required to constrain ![]() to a higher significance with the NIRSpec prism (top) and G140M grating (bottom) modes using our approach. Dotted lines show normalized
to a higher significance with the NIRSpec prism (top) and G140M grating (bottom) modes using our approach. Dotted lines show normalized ![]() distributions from our simulations at xHI = [0.5,0.7,0.9]. Solid lines and shaded regions show the recovered median Db and 68% credible interval from sampling N galaxies each with Db drawn from these distributions, assuming a median uncertainty on Db of 0.7 and 0.3 dex for the prism and G140M observations respectively (corresponding to S/N ≈ 20 and 5 per pixel respectively).
distributions from our simulations at xHI = [0.5,0.7,0.9]. Solid lines and shaded regions show the recovered median Db and 68% credible interval from sampling N galaxies each with Db drawn from these distributions, assuming a median uncertainty on Db of 0.7 and 0.3 dex for the prism and G140M observations respectively (corresponding to S/N ≈ 20 and 5 per pixel respectively).
Current usage metrics show cumulative count of Article Views (full-text article views including HTML views, PDF and ePub downloads, according to the available data) and Abstracts Views on Vision4Press platform.
Data correspond to usage on the plateform after 2015. The current usage metrics is available 48-96 hours after online publication and is updated daily on week days.
Initial download of the metrics may take a while.