Fig. 2.
Download original image
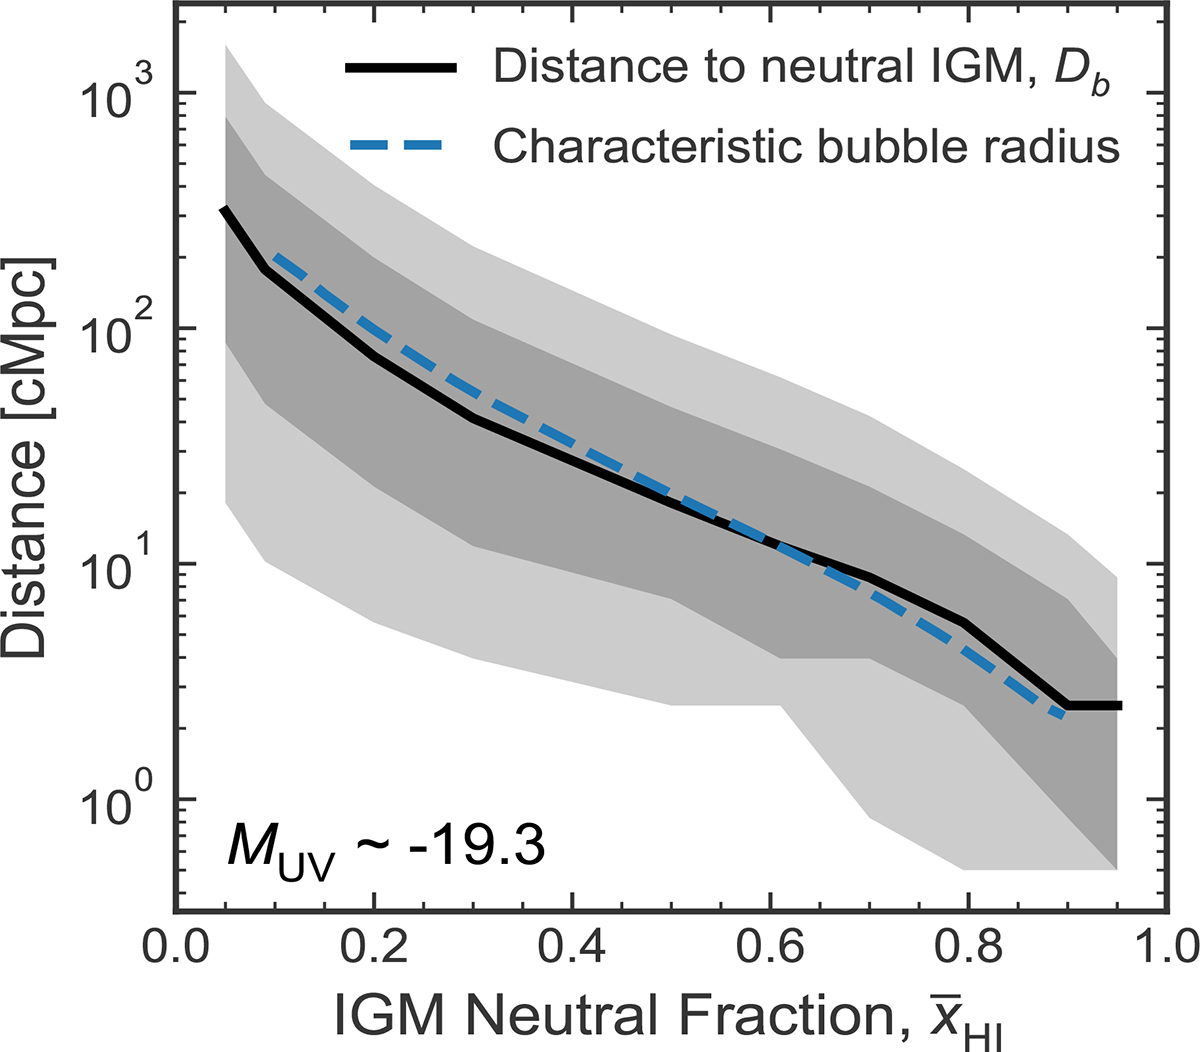
Median, 68% and 95% range of distances of MUV ∼ −19.3 galaxies (the median in our sample) to the neutral IGM, Db as a function of ![]() from the simulations used in this work (see Section 2.1.1Lu et al. 2024). The median Db closely tracks the characteristic (mean) bubble radius in the simulations (blue dashed line), and shows a very broad distribution as the size distribution of ionized bubbles is broad (see Figure 1) and galaxies can sit in a range of locations inside bubbles, not always in the centre.
from the simulations used in this work (see Section 2.1.1Lu et al. 2024). The median Db closely tracks the characteristic (mean) bubble radius in the simulations (blue dashed line), and shows a very broad distribution as the size distribution of ionized bubbles is broad (see Figure 1) and galaxies can sit in a range of locations inside bubbles, not always in the centre.
Current usage metrics show cumulative count of Article Views (full-text article views including HTML views, PDF and ePub downloads, according to the available data) and Abstracts Views on Vision4Press platform.
Data correspond to usage on the plateform after 2015. The current usage metrics is available 48-96 hours after online publication and is updated daily on week days.
Initial download of the metrics may take a while.