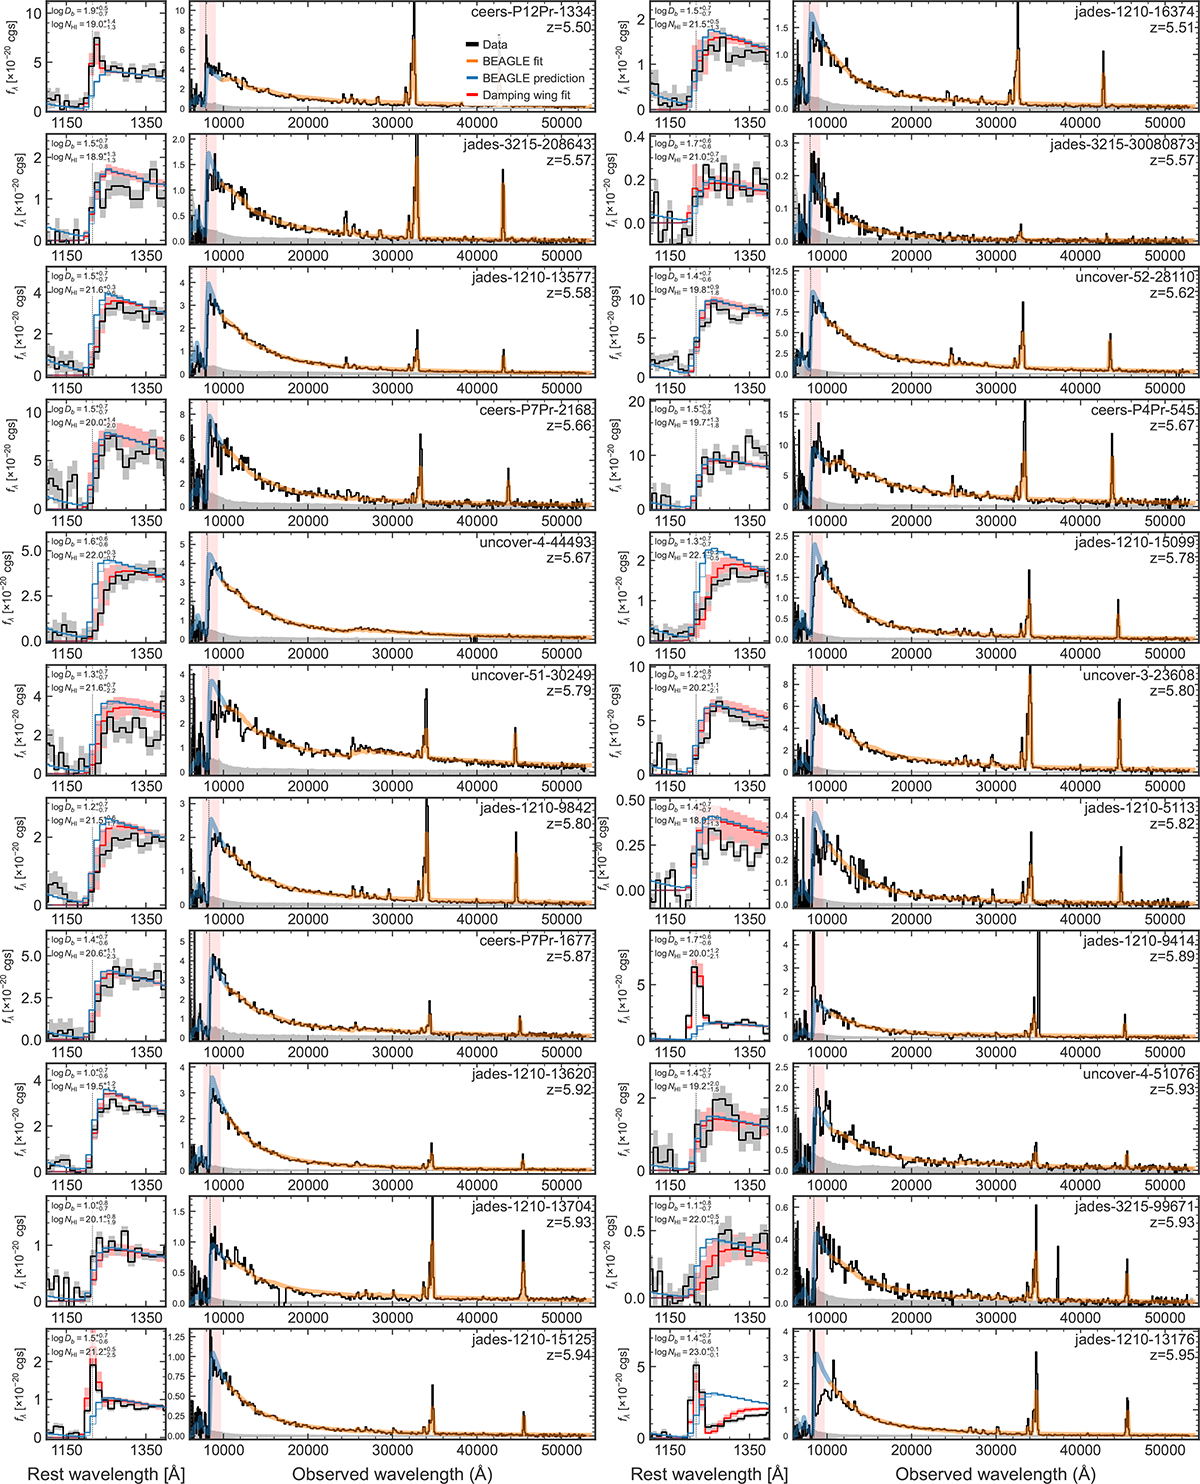
Fig. F.1.
Download original image
Spectra of our sample in ascending redshift order. We show the NIRSpec prism spectra in black with the error spectrum in shaded grey. The best-fit BEAGLE model is shown in orange, convolved to the prism resolution. The blue lines are the extrapolation of the BEAGLE model to the rest-frame < 1500 Å, which is the predicted continuum spectrum we use for our damping wing fits (Section 4). Small panels show the damping wing fit zoomed in around 1100-1400 Å in the rest-frame (marked as the red shaded region on the full spectra). The thick blue lines show the BEAGLE continuum model extrapolation in an ionized IGM, the thin blue lines show the continuum model assuming a fully neutral IGM with no ionized bubble around the source. The red line and shaded region showing median and 68% range of samples from posteriors.
Current usage metrics show cumulative count of Article Views (full-text article views including HTML views, PDF and ePub downloads, according to the available data) and Abstracts Views on Vision4Press platform.
Data correspond to usage on the plateform after 2015. The current usage metrics is available 48-96 hours after online publication and is updated daily on week days.
Initial download of the metrics may take a while.