Fig. 3.
Download original image
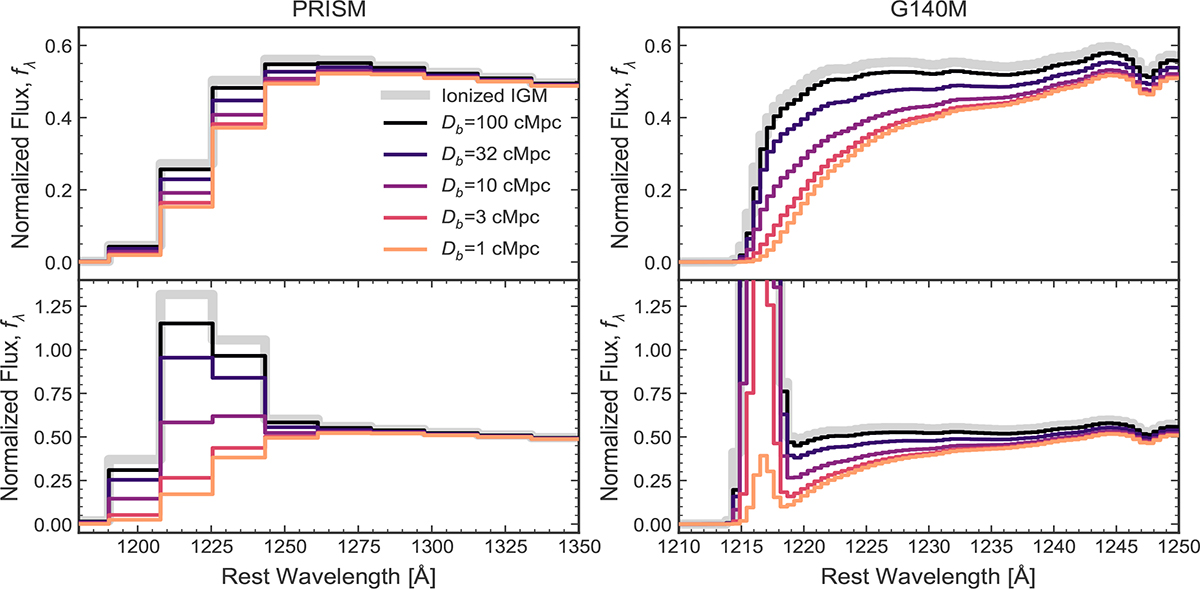
Mock spectra at z = 10 demonstrating the impact of the distance from neutral IGM, Db. Left (right) panels show the spectrum convolved to the resolution of the NIRSpec prism (G140M grating). The grey line shows the spectrum in an almost fully ionized IGM (i.e. Lyα is attenuated only blueward of resonance by the Gunn & Peterson (1965) optical depth). Coloured lines show the spectrum if the galaxy is a distance Db = 1 − 100 cMpc from the neutral IGM. The top panels show a case with no Lyα emission, while the bottom panels show the same spectrum including Lyα emission with pre-IGM EW = 100 Å, FWHM = 200 km s−1 and Δv = 200 km s−1, where weak Lyα due to the smallest Db can only be clearly identified in the G140M spectrum.
Current usage metrics show cumulative count of Article Views (full-text article views including HTML views, PDF and ePub downloads, according to the available data) and Abstracts Views on Vision4Press platform.
Data correspond to usage on the plateform after 2015. The current usage metrics is available 48-96 hours after online publication and is updated daily on week days.
Initial download of the metrics may take a while.