Open Access
Fig. 6.
Download original image
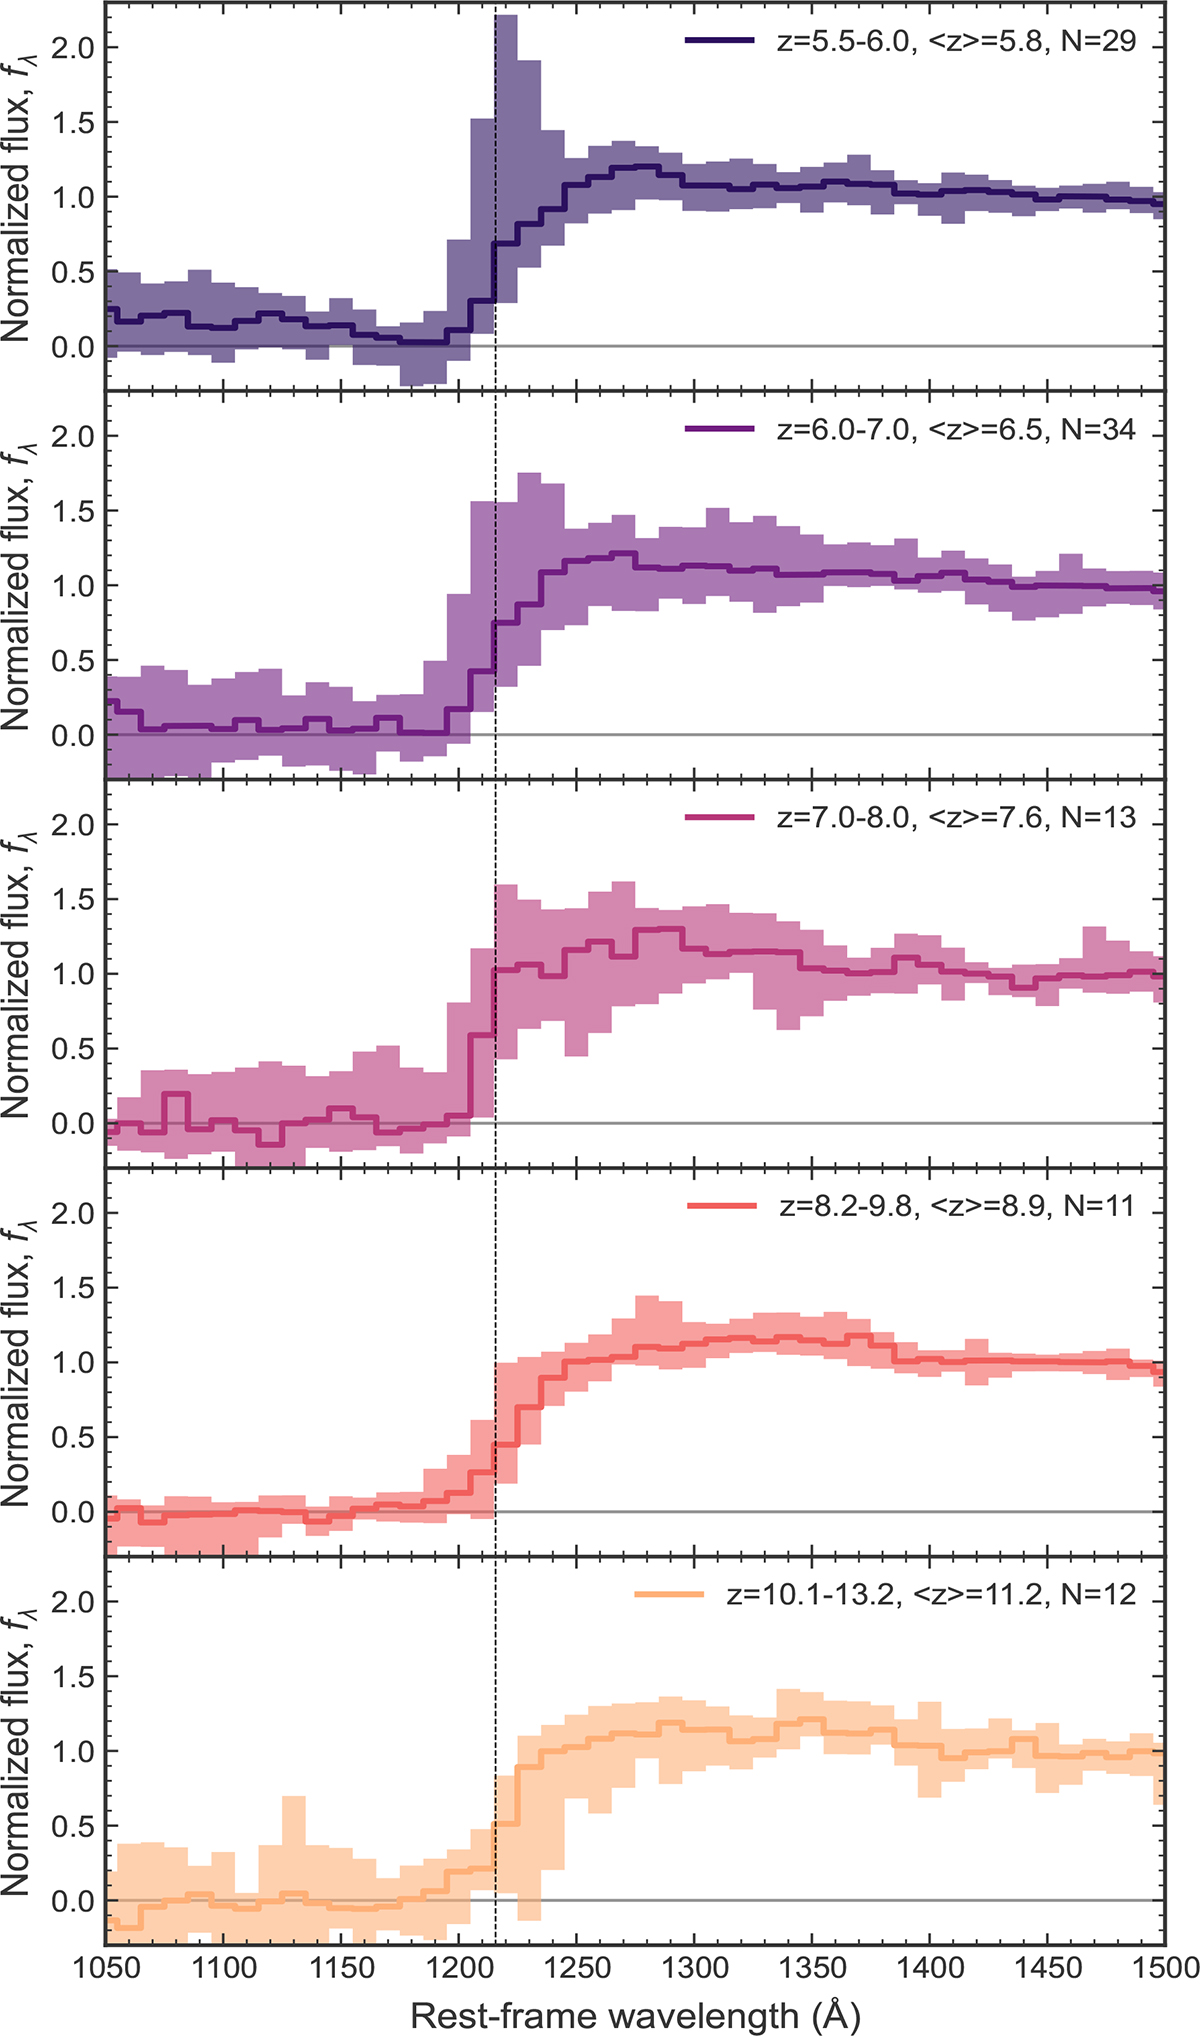
Median stacked spectra in our sample of 99 sources in redshift bins. Shaded regions show the 16–84% range of the spectra in each redshift bin. We see a clear decrease in flux and the variance of the spectra around the Lyα break with increasing redshift.
Current usage metrics show cumulative count of Article Views (full-text article views including HTML views, PDF and ePub downloads, according to the available data) and Abstracts Views on Vision4Press platform.
Data correspond to usage on the plateform after 2015. The current usage metrics is available 48-96 hours after online publication and is updated daily on week days.
Initial download of the metrics may take a while.