Fig. 8.
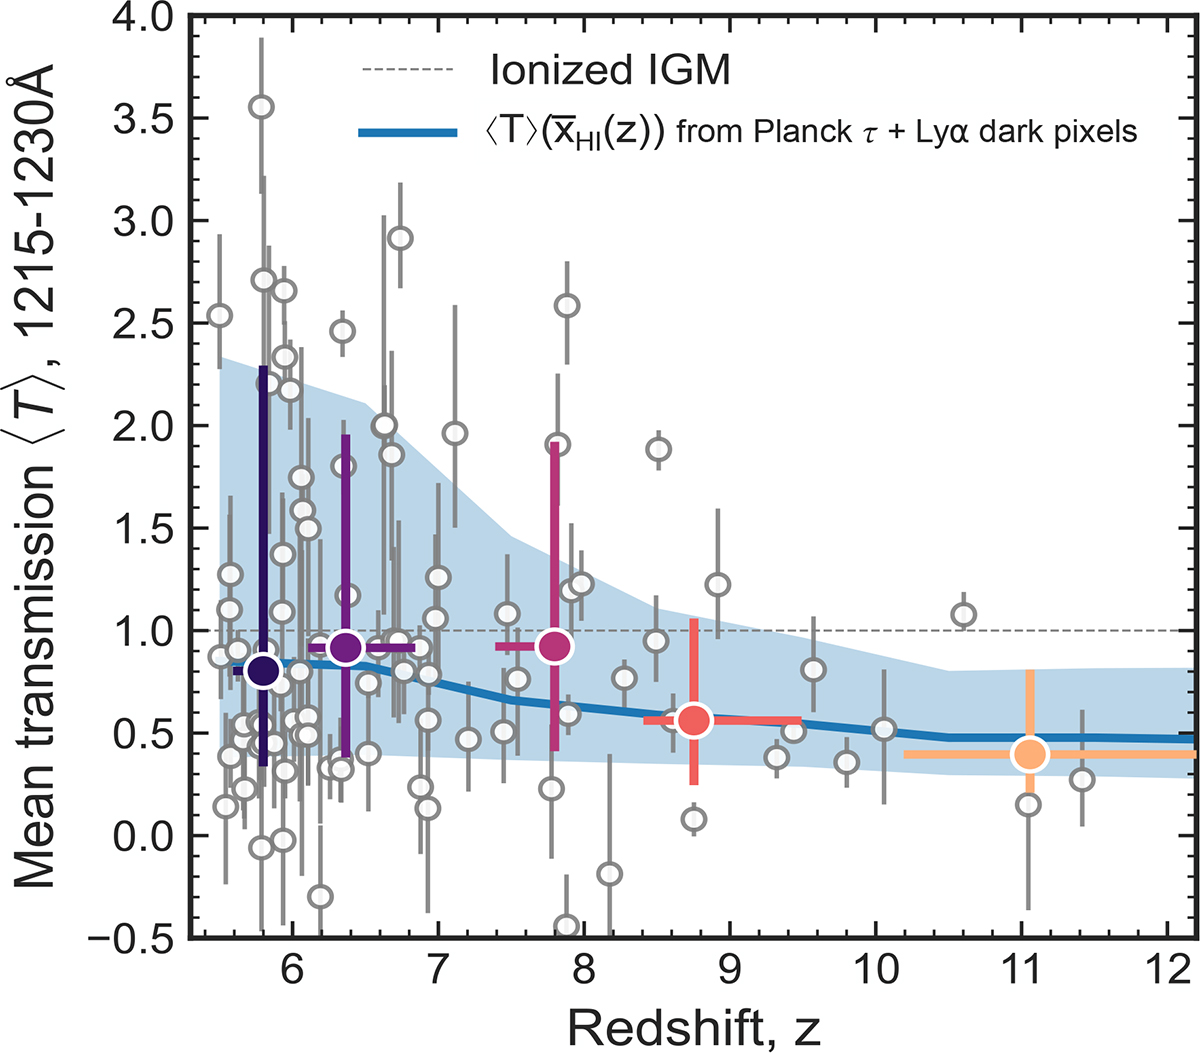
Download original image
Mean transmission, ⟨T⟩, over 1215 − 1230 Å rest-frame for each galaxy in our sample (grey circles), as a function of spectroscopic redshift, including only sources with redshifts from emission lines. ⟨T⟩ corresponds to the flux around the Lyα break relative to the predicted galaxy continuum in an ionized IGM, with no contribution from Lyα emission or absorption by HI. Thus ⟨T⟩> 1 corresponds to Lyα emission, and ⟨T⟩< 1 to absorption. We show the median and 68% range of ⟨T⟩ in four redshift bins (coloured circles). The blue line and shaded regions shows the predicted median and 68% range of ⟨T⟩ assuming the z ≲ 6 template spectra described in Section 5.1 and the reionisation history inferred by Mason et al. (2019). The observed median and range are in close agreement with the IGM prediction.
Current usage metrics show cumulative count of Article Views (full-text article views including HTML views, PDF and ePub downloads, according to the available data) and Abstracts Views on Vision4Press platform.
Data correspond to usage on the plateform after 2015. The current usage metrics is available 48-96 hours after online publication and is updated daily on week days.
Initial download of the metrics may take a while.