Fig. 6.
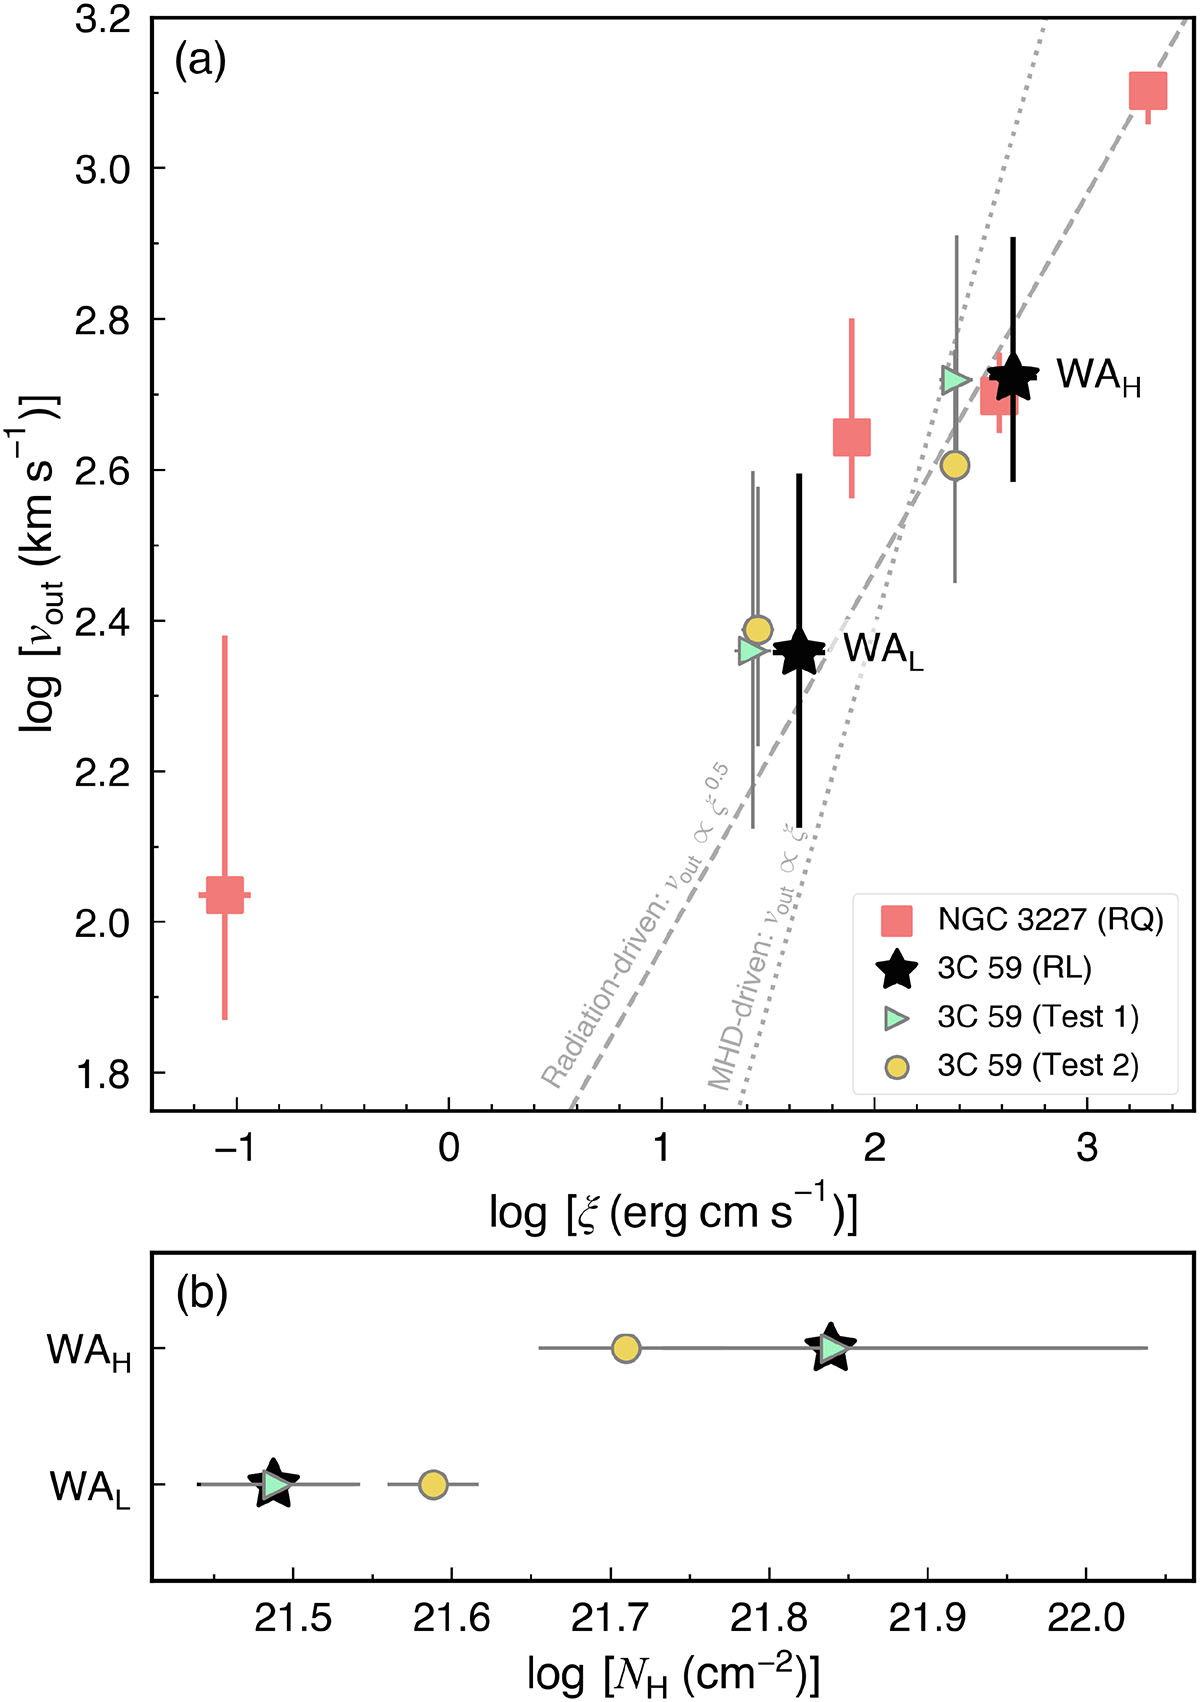
Download original image
Outflowing velocity (vout) plotted against ionization parameter (ξ) (panel a) and distribution of hydrogen column density (panel b) of a radio-loud (RL) AGN 3C 59. The black stars are the best-fit results obtained by the spectral fitting strategy that we adopted in this work. The symbols with gray edges represent the best-fit results based on different spectral fitting strategies: spectral fitting without NIR-optical-UV data and adopting different SED compositions (Test 1; green triangles) and spectral fitting with inclusion of the EPIC-pn spectrum in the energy range of 0.3−2 keV (Test 2; yellow circles) (see details in Section 4.4). The red squares are the best-fit results for a radio-quiet (RQ) AGN NGC 3227, which are derived from Wang et al. (2022b). The vout − ξ relations of the radiation pressure-driven (dashed gray line) and MHD-driven (dotted gray line) mechanisms are scaled to the average values of WAH and WAL of 3C 59 (two black stars).
Current usage metrics show cumulative count of Article Views (full-text article views including HTML views, PDF and ePub downloads, according to the available data) and Abstracts Views on Vision4Press platform.
Data correspond to usage on the plateform after 2015. The current usage metrics is available 48-96 hours after online publication and is updated daily on week days.
Initial download of the metrics may take a while.