| Issue |
A&A
Volume 705, January 2026
|
|
|---|---|---|
| Article Number | A95 | |
| Number of page(s) | 14 | |
| Section | Extragalactic astronomy | |
| DOI | https://doi.org/10.1051/0004-6361/202553945 | |
| Published online | 09 January 2026 | |
Warm absorber outflows in radio-loud active galactic nucleus 3C 59
1
School of Astronomy and Space Science, Nanjing University 163 Xianlin Avenue Nanjing 210023, PR China
2
Key Laboratory of Modern Astronomy and Astrophysics, Nanjing University, Ministry of Education 163 Xianlin Avenue Nanjing 210023, PR China
3
Department of Astronomy, Tsinghua University Haidian DS 100084 Beijing, PR China
4
Institute of Space Sciences (ICE, CSIC), Campus UAB Carrer de Can Magrans s/n 08193 Barcelona, Spain
5
Institut d’Estudis Espacials de Catalunya (IEEC), Esteve Terradas 1, RDIT Building Of. 212 Mediterranean Technology Park (PMT) 08860 Castelldefels, Spain
6
CAS Key Laboratory for Research in Galaxies and Cosmology, Department of Astronomy, University of Science and Technology of China Hefei 230026, PR China
7
School of Astronomy and Space Sciences, University of Science and Technology of China Hefei 230026, PR China
8
Department of Astronomy, Xiamen University, Xiamen Fujian 361005, PR China
9
Leiden Observatory, Leiden University PO Box 9513 2300 RA Leiden, The Netherlands
10
SRON Netherlands Institute for Space Research Niels Bohrweg 4 2333 CA Leiden, The Netherlands
11
Shanghai Astronomical Observatory, Chinese Academy of Science No. 80 Nandan Road Shanghai, PR China
12
Space Telescope Science Institute 3700 San Martin Drive Baltimore MD 21218, USA
13
Department of Astronomy, University of Michigan 1085 South University Avenue Ann Arbor MI 48109, USA
★ Corresponding authors: This email address is being protected from spambots. You need JavaScript enabled to view it.
, This email address is being protected from spambots. You need JavaScript enabled to view it.
Received:
29
January
2025
Accepted:
6
October
2025
Abstract
Context. Both jets and ionized outflows in active galactic nuclei (AGNs) are thought to play important roles in affecting the star formation and evolution of host galaxies, but their relationship is still unclear.
Aims. As a pilot study, we performed a detailed spectral analysis of a radio-loud (RL) AGN 3C 59 (z = 0.1096) by systematically considering various factors that may affect the fitting results, thereby establishing a general spectral fitting strategy for subsequent research with a larger sample. AGN 3C 59 is a rare target for simultaneously studying jets and warm absorbers, which are one type of ionized outflow.
Methods. Based on the multiwavelength data from near-infrared (NIR) to hard X-ray bands detected by the Dark Energy Spectroscopic Instrument, Galaxy Evolution Explorer, and XMM-Newton, we used the spex code to build broadband continuum models and perform photoionization modeling with the pion code to constrain the physical parameters of warm absorbers in 3C 59.
Results. We found two warm absorbers with ionization parameters of log[ξ / (erg cm s−1) ] = 2.65−0.09+0.10 and 1.65 ± 0.11; their outflowing velocities are vout = −528−222+163 km s−1 and −228−122+121 km s−1, respectively. These warm absorbers are located between the outer torus and the narrow (emission-)line region, and their positive vout − ξ relation can be explained by the radiation pressure-driven mechanism. We found that the estimations of these physical properties are affected by the different spectral fitting strategies, such as the inclusion of NIR to ultraviolet data, the choice of energy range of spectrum, or the composition of the spectral energy distribution.
Conclusions. Based on the same fitting strategy, this work presents a comparative study of the outflow-driven mechanism between a RL AGN (3C 59) and a radio-quiet AGN (NGC 3227), which suggests a similar driven mechanism of their warm absorber outflows and a negligible role of jets in this process.
Key words: galaxies: active / galaxies: jets / galaxies: nuclei / X-rays: galaxies / quasars: individual: 3C 59
© The Authors 2026
 Open Access article, published by EDP Sciences, under the terms of the Creative Commons Attribution License (https://creativecommons.org/licenses/by/4.0), which permits unrestricted use, distribution, and reproduction in any medium, provided the original work is properly cited.
This article is published in open access under the Subscribe to Open model. This email address is being protected from spambots. You need JavaScript enabled to view it. to support open access publication.
1. Introduction
Many observational proofs have implied that active galactic nuclei (AGNs) play an important role in affecting the star formation and evolution of their host galaxies through high kinetic or radiative power, known as AGN feedback (e.g., Fabian 2012; King & Pounds 2015; Fiore et al. 2017; Matzeu et al. 2023). The kinetic feedback through large-scale jets or ionized outflows injects large amounts of energy and matter into the host galaxies and even the surrounding environments, which makes it a very effective feedback mechanism (Boehringer et al. 1993; Fabian et al. 2006). However, there are still many open questions about the connection between jets and ionized outflows that are important for our understanding on AGN feedback. Jets are believed to be magnetically powered (Blandford & Znajek 1977; Blandford & Payne 1982), while the origins and launching mechanisms of the ionized outflows are more unclear.
Warm absorbers are one type of ionized outflow; they have ionization parameter (ξ) ranging from ∼10−1 to ∼103 erg cm s−1, and outflowing velocity ranging from ∼ − 100 to ∼ − 2000 km s−1 (e.g., Kaastra et al. 2000; Laha et al. 2021). This type of outflow is usually located between the accretion disk and the narrow (emission-)line region (NLR) (∼0.001 pc to ∼1 kpc; e.g., Blustin et al. 2005; Krongold et al. 2007; Kaastra et al. 2012; Silva et al. 2016; Mehdipour et al. 2018; Laha et al. 2021). Warm absorbers are usually thought to be driven by various mechanisms, such as radiation pressure (e.g., Proga & Kallman 2004), magnetic forces (e.g., Blandford & Payne 1982; Konigl & Kartje 1994; Fukumura et al. 2010), or thermal pressure (e.g., Begelman et al. 1983; Krolik & Kriss 1995; Mizumoto et al. 2019). Among these mechanisms, the radiation pressure-driven mechanism may play a crucial role because warm absorbers are mainly dusty winds (e.g., Yamada et al. 2024). Recent studies have found that nearly 50% of nearby radio-quiet Seyfert galaxies are detected with warm absorbers (e.g., Reynolds 1997; Tombesi et al. 2013; Laha et al. 2014, 2021), while warm absorbers are only found in a few radio-loud AGNs (Reeves et al. 2009, 2010; Torresi et al. 2010, 2012; Di Gesu & Costantini 2016; Mehdipour & Costantini 2019; Kayanoki et al. 2024). To date, a direct physical relationship between jets and warm absorbers has not been well established. Mehdipour & Costantini (2019) (hereafter M19) argued that changes of magnetic-field configuration from toroidal to poloidal may power either warm absorbers or jets, and Torresi et al. (2012) found that powerful jets may favor the escape of more massive warm absorbers. In addition, many works have found that kiloparsec-scale [OIII]λ5007 ionized outflows are driven by expanding radio jets, which may be connected with the interaction between jets and the ambient circumnuclear medium (ACM) (e.g., Tadhunter et al. 2001; Holt et al. 2006, 2008; Singha et al. 2023; Peralta de Arriba et al. 2023). However, whether jets can drive warm absorbers still remains unclear. Therefore, more studies of warm absorbers in radio-loud AGNs are required to help us understand the underlying connection between jets and warm absorbers, and further investigate the interaction between jets and ACM at smaller scales.
The correlation between ionization parameter and outflowing velocity of warm absorbers characterizes not only the driving mechanisms of outflows (e.g., Fukumura et al. 2010; Tombesi et al. 2013), but also the density profile of the ACM in the center of galaxies (Wang et al. 2022a). The latter is an important tracer of the accretion history and accretion physics of central supermassive black holes (SMBHs) (e.g., Bondi 1952; Narayan & Yi 1994; Frank et al. 2002; Yuan & Narayan 2014). To date, the density profile of the ACM has been estimated for only several nearby galaxies (Wong et al. 2011; Russell et al. 2015; Miller & Bregman 2015; Gillessen et al. 2019), a few galaxies that host tidal disruption events (Alexander et al. 2016, 2020; Eftekhari et al. 2018; Anderson et al. 2020), and several radio-quiet AGNs (Wang et al. 2022a), while there is a lack of studies on the ACM density profile in radio-loud AGNs. Exploring the properties of warm absorbers in radio-loud AGNs may help us investigate the density profile of their ACM, and further enhance our understanding on the SMBH accretion physics in radio-loud AGNs.
3C 59 (z = 0.1096, Eracleous & Halpern 2004) is a Fanaroff Riley Class II (FRII) radio-loud AGN with radio lobes extending to at least 150 kpc (Wang et al. 2025, hereafter Paper I). It is one of three radio-loud AGNs that shows multiphase warm absorbers (M19), which is necessary for studying the evolution of outflows and density profile of ACM. 3C 59 also has a wealth of photometric data and spectral data in multiwavelength bands (see Paper I), which is useful for constructing broadband spectral energy distribution (SED) and performing spectral analysis to obtain various physical properties. In Paper I we obtained various physical properties for the host galaxy of 3C 59 and separated AGN fluxes in the optical bands from the entire galaxy, which is greatly helpful for constraining continuum models of central engine and studying physical properties of warm absorbers in this work. These observational results make 3C 59 a rare case to simultaneously study warm absorbers and jets. This work focuses on the physical properties of warm absorbers in 3C 59, and their (non)connection with jet.
In addition, different works usually adopt distinct spectral fitting strategies to estimate the physical properties of warm absorbers, such as whether to incorporate optical/UV data to constrain the continuum models, the choice of spectral coverage of each instrument, the selection of different photoionization plasma codes, and the composition of SED models. Mehdipour et al. (2016) made a systematic comparison of various photoionization plasma codes and found that the deviation across the different codes in the ionization parameter at which ionic abundances of H-like or B-like ions peak is about 10%, while for C-like to Fe-like ions, this deviation is about 40%. However, to date, few works have investigated the potential impact of optical/UV data inclusion, spectral range selection, and SED compositions on spectral fitting outcomes, which should be accounted for especially when comparing or combining the results in different works. Therefore, another important goal of this work is to study these potential impacts through comparing the best-fit results between different spectral fitting strategies. In addition, we present this work as a pilot study to validate our spectral fitting strategy, while also preparing for its future application to large-sample research.
This paper is organized as follows. In Section 2 we present the observational data used in this work and data reduction for the XMM-Newton data. In Section 3 we introduce the details for constructing broadband SEDs and performing spectral analyses. In Section 4 we present the best-fit results of warm absorbers and discuss their physical properties, such as absorption features, possible driving mechanisms, potential effects caused by different spectral fitting strategies, distance to the SMBH, and possible (non)connection with jets. In Section 5 we give a summary of our conclusions. For this work we used the C-statistic (Cash 1979; Kaastra 2017, hereafter C-stat) to estimate the goodness of fit. The statistical errors of parameters are given at the 1σ (68%) confidence level. Throughout this paper we assume a flat cosmology with the following parameters: Ωm = 0.3, ΩΛ = 0.7, and H0 = 70 km s−1 Mpc−1.
2. Observations and data processing
2.1. NIR-optical-UV data
The clean AGN fluxes at the g, r, and z filters were derived from two-dimensional decompositions of the Dark Energy Spectroscopic Instrument (DESI) images (see Paper I). The reference wavelengths (λref) of the g, r, and z filters are 4703 Å, 6176 Å, and 8947 Å, respectively1. We refer to Paper I for more details of the image decomposition, and here we only give a brief introduction. In the image decomposition with the GALIGHT code (Ding et al. 2021), the AGN component is modeled using a point spread function (PSF) based on stars within the detection area, while the host galaxy is modeled with a smooth Sérsic profile. The DESI photometric data were corrected with the Galactic extinction and the intrinsic extinction from the host galaxy of 3C 59. For the Galactic extinction, we considered the Fitzpatrick (1999) reddening law with RV = 3.1 based on the dust map from Schlegel et al. (1998). For the intrinsic extinction from the host galaxy of 3C 59, we adopted E(B − V) = 0.077 mag, which was estimated through fitting the multiwavelength photometric data with the Code Investigating GALaxy Emission (CIGALE; Burgarella et al. 2005; Noll et al. 2009; Boquien et al. 2019; Yang et al. 2020, 2022) in Paper I. The extinction-corrected DESI AGN fluxes at the g, r, and z filters are 0.17 ± 0.04 mJy, 0.20 ± 0.01 mJy, and 0.44 ± 0.03 mJy, respectively.
We also utilized the UV and optical photometric data detected by the Galaxy Evolution Explorer (GALEX) and Optical Monitor (OM) on board XMM-Newton. The photometric data at the far-ultraviolet (FUV; λref ∼ 1535 Å) and near-ultraviolet (NUV; λref ∼ 2301 Å) filters of GALEX were derived from Morrissey et al. (2007). After correction for the Galactic and intrinsic extinctions, the observational fluxes at the FUV and NUV filters are 0.36 ± 0.02 mJy and 0.43 ± 0.02 mJy, respectively. The OM images were processed with the Science Analysis System (SAS v20.0.0) omichain pipeline according to the standard parameters. The OM images of 3C 59 (observation ID 0205390201) were taken at the V, B, U, UVW1, and UVM2 filters with reference wavelengths of 5425 Å, 4337 Å, 3477 Å, 2931 Å, and 2327 Å, respectively. The OM data were also corrected with the Galactic extinction and the intrinsic extinction from the host galaxy of 3C 59. The extinction-corrected fluxes at the V, B, U, UVW1, and UVM2 filters are 1.65 ± 0.01 mJy, 1.08 ± 0.005 mJy, 0.98 ± 0.004 mJy, 0.77 ± 0.004 mJy, and 0.45 ± 0.005 mJy, respectively.
2.2. X-ray data reduction
The EPIC-pn and RGS data of 3C 59 (observation ID 0205390201) were processed using the SAS v20.0.0 following the standard data analysis procedure2. The cleaned event files of the EPIC-pn data were produced through the SAS task epproc. The single event (“PATTERN= = 0”) and 10−12 keV high-energy light curve (“PI> 10000&&PI< 12000”) were extracted from the event file, based on which flaring particle background above a count rate threshold of 0.3 counts s−1 was filtered. The EPIC-pn spectrum of the source was extracted from a circular region with a radius of 50″ centered on the source and the background spectrum was extracted from a nearby source-free circular region with a radius of 150″. The SAS tasks rmfgen and arfgen were used to produce response matrices files and ancillary response files, respectively. Then we used the SAS task rgsproc to extract the first-order data of RGS1 and RGS2. For each RGS, the flaring particle background larger than 0.1 counts s−1 was excluded based on the light curve of CCD 9. To improve the signal-to-noise ratio, we combined the spectra of RGS1 and RGS2 through the SAS task rgscombine.
3. Spectral analysis
We performed a detailed spectral analysis based on the spex package (Kaastra et al. 1996) v.3.08.00 (Kaastra et al. 2024). First, following Mao et al. (2022a), Kayanoki et al. (2024), and Zhou et al. (2024), we cross-calibrated the RGS and EPIC-pn spectra. Through matching their fluxes at a common energy band, we found that the RGS spectrum needs to be rescaled by a factor of 1.03 to match the EPIC-pn spectrum. In the spectral fitting, we used the EPIC-pn spectrum in the energy range of 2−10 keV and RGS spectrum in the wavelength range of 6−38 Å, which is consistent with the approach adopted for NGC 3783 (Mao et al. 2019), NGC 3227 (Wang et al. 2022b; Mao et al. 2022b), MR 2251−178 (Mao et al. 2022a), Mrk 6 (Kayanoki et al. 2024), and RE J1034+396 (Zhou et al. 2024). In addition, the EPIC-pn spectrum was optimally binned using the obin command in the spex (Kaastra & Bleeker 2016), and the RGS spectrum was binned by a factor of 2 required by optimal binning. Then the observational data from NIR to X-ray bands were fit by the following models in the spex, which are also summarized in Table 1.
Best-fit parameters of SED models and warm absorbers for 3C 59.
3.1. Intrinsic broadband SED
Similar to NGC 3227 (Mehdipour et al. 2021) and MR 2251−178 (Mao et al. 2022a), the intrinsic SED model of 3C 59 includes an accretion disk blackbody component, a warm Comptonization component, an X-ray power-law component, and a neutral X-ray reflection component. Each component is introduced in detail below.
To determine the accretion disk model (dbb model in spex), NIR-optical-UV data solely from AGNs are required. Thus, AGN fluxes at the DESI g, r, and z filters can be directly used. However, for GALEX and OM data, it is difficult to separate the contributions from the AGN and the host galaxy, while contributions of the host galaxy cannot be ignored3 (see details in Paper I). Therefore, we only used the GALEX and OM data as upper limits in this work. In addition, only three DESI flux data points can be used, which does not allow us to better constrain the dbb model with all the parameters free. Therefore, given that the central engines of 3C 59 and 3C 382 have many similar physical properties, such as black hole masses4, bolometric luminosities, X-ray luminosities, Eddington ratios5, and radio classifications6, we fixed the disk temperature (kTBB) of 3C 59 to that of 3C 382, which is 3.4 eV (Ursini et al. 2018). Then, considering that the DESI image at the g-filter has a deeper imaging and a higher data quality than those at the r and z filters (see Paper I), we directly scaled the normalization of the dbb model to match the extinction-corrected DESI g-filter AGN flux. The resulting dbb model has been verified as being nearly consistent with the DESI AGN fluxes at the r and z filters, and as being below the fluxes of the GALEX and OM data. Here we did not utilize the spectrum (3700 Å to 9000 Å) detected by the Large Sky Area Multi-Object Fiber Spectroscopic Telescope (LAMOST) for 3C 59 (see Section 4.3) because the true contributions from the AGN are hard to reliably extract as we mention above.
Only a dbb model cannot reasonably match the observational data in the soft X-ray bands. Therefore, a warm Comptonization component (comt model in spex) was introduced to explain the soft X-ray excess that is usually thought to be produced by the up-scattering of the seed photons from accretion disks in a warm Comptonizing corona. In the fit, the seed temperature (kT0) was fixed to the disk temperature. Following Mehdipour et al. (2021), the optical depth (τ) was fixed to a fiducial value of 30 in order to limit the number of free parameters and reduce the parameter degeneracy. The normalization and plasma temperature (kT1) were free in the fit.
The X-ray power-law component (pow model in the spex) was used to model the observational data in the hard X-rays, which is usually thought to be produced by an optically thin hot corona. In the fit, its high-energy exponential cutoff (Ecut) was fixed to 150 keV, which is the average value of a FRII-dominated sample (Kang et al. 2020). The low-energy exponential cutoff in the fit was fixed to 13.6 eV.
The X-ray power-law component is usually accompanied by a neutral X-ray reflection component (refl model in spex) that may reprocess the incident power-law continuum to produce the observed Fe Kα line and the Compton hump at higher energies. In the fit, the normalization and photon index of the incident power law were coupled to those of the pow model, and only the reflection scale (s) was kept free.
3.2. The Galactic neutral gas
The absorption features caused by the Galactic neutral gas were modeled by the hot model in the spex. Its hydrogen column density (NH) was fixed to 6.59 × 1020 cm−2 (Véron-Cetty & Véron 2010, M19), and its electron temperature was fixed to 0.001 eV to mimic the transmission of a neutral plasma7.
3.3. Warm absorbers
The absorption features produced by the warm absorbers were modeled by the pion model in the spex. The pion model is a robust photoionization code where the photoionization equilibrium can be calculated self-consistently using the available plasma routines and atomic database of spex. The hydrogen column density (NH), ionization parameter (ξ), turbulent velocity (σv), and outflowing velocity (vout) of this model were free in the fit. We assume that the X-ray emitting region is fully covered by warm absorbers, so the covering factors of warm absorbers are fixed to 1. The ionization parameter is defined as
 (1)
(1)
where Lion is the ionizing luminosity over 1−1000 Ryd (13.6 eV to 13.6 keV), nH is the hydrogen number density of the absorbing clouds, and r is the radial distance of the absorbing clouds to the central BH (Tarter et al. 1969).
4. Results and discussions
4.1. Intrinsic continuum models of 3C 59
The best-fit model can nicely describe the X-ray spectral data (see Fig. 1). The unabsorbed intrinsic continuum models are shown in Fig. 2 and their parameters are summarized in Table 1. The intrinsic luminosities estimated by the total intrinsic continuum model are also summarized in Table 1. The intrinsic bolometric luminosity and 0.3−10 keV luminosity of 3C 59 are about Lbol = 3.45 × 1045 erg s−1 and L0.3 − 10 keV = 5.19 × 1044 erg s−1, respectively, both of which are consistent with those obtained in M19. The intrinsic 2−10 keV luminosity is around L2 − 10 keV = 2.82 × 1044 erg s−1, and the ionizing luminosity over 1−1000 Ryd is about Lion = 1.79 × 1045 erg s−1. The Eddington luminosity (LEdd) of 3C 59 is 1.02 × 1047 erg s−1, which is estimated by LEdd = 1.25 × 1038 × (MBH/M⊙) (Rybicki & Lightman 1979) where MBH is the black hole mass of 108.9 M⊙ for 3C 59 (Wu & Liu 2004). Thus, according to the definition of Eddington ratio (λEdd = Lbol/LEdd), λEdd of 3C 59 is estimated to be 0.03. The mass accretion rate Ṁacc is 0.62 M⊙ yr−1, which is estimated by Ṁacc ≈ Lbol/(ηc2) assuming an accretion efficiency η = 0.1. These parameters are summarized in Table 2.
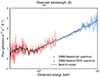 |
Fig. 1. XMM-Newton spectra and the best-fit model with spex. The red points denote the RGS spectrum and the blue points represent the EPIC-pn spectrum. The solid black curve shows the best-fit model. For visualization purposes, here the RGS spectrum is binned by a factor of 10. |
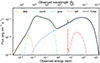 |
Fig. 2. Best-fit intrinsic SED models. The dotted orange line represents an accretion disk blackbody component (dbb). The dash-dotted green line denotes a warm Comptonization component (comt). The dashed blue line means an X-ray power-law component (pow). The dash-dotted red line shows a neutral X-ray reflection component (refl). The solid black line represents the total best-fit continuum model. |
Properties of 3C 59.
4.2. Properties of warm absorbers in 3C 59
The main absorption features produced by warm absorbers of 3C 59 are shown in Fig. 3. Compared to the spectral fitting result with only continuum models and the Galactic absorptions (see the upper panel of Fig. 4), adding the high-ionization warm absorber (WAH) improves the fitting with a C-stat differential of ΔC ∼ 215.1 (see the middle panel of Fig. 4). Then we added a low-ionization warm absorber (WAL), which improves the fitting with ΔC ∼ 84.5 (see the bottom panel of Fig. 4). Adding the third pion model that is used to model the third warm absorber with a lower ionization parameter (log[ξ/(erg cm s−1)] < 1) only improves the fitting by ΔC ∼ 10.4, which is insignificant (see the fitting results with three pion models in Appendix A and Table A.1) and may require a spectrum with higher S/N to be reliably resolved. Thus, we only take two warm absorbers (WAH and WAL; see Table 1) into account in this work. In addition, the absorption residual around 9 keV is not significant enough to prove a ultra-fast outflow (UFO) (Tombesi et al. 2014), and thus will not affect the spectroscopy results, such as intrinsic luminosity and ionization balance of warm absorbers.
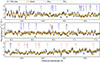 |
Fig. 3. 13−20 Å RGS spectrum with main absorption features produced by the warm absorbers of 3C 59. The black points represent the RGS spectrum and the solid orange line denotes the best-fit model. The dashed blue lines and dotted red lines are the main absorption lines produced by the high-ionization warm absorber (WAH) and the low-ionization warm absorber (WAL), respectively. |
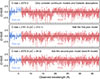 |
Fig. 4. Residual of spectral fitting with different models. The residual (D-M)/E stands for (data–model)/error. Top panel: Spectral fitting with only continuum models and the Galactic absorptions. Middle panel: Spectral fitting after adding the first pion model on the models shown in the top panel. This pion model is used to model the high-ionization warm absorber. The ΔC here means the C-stat differential between the spectral fitting results in the top and middle panels. Bottom panel: Spectral fitting after adding the second pion model on the models shown in the middle panel. This pion model is used to model the low-ionization warm absorber. The ΔC here means the C-stat differential between the spectral fitting results in the middle and bottom panels. |
The best-fit physical parameters for WAH and WAL are summarized in Table 1. The WAH has an ionization parameter of ![Mathematical equation: $ \log [\xi/(\mathrm{erg\,cm\,s^{-1}})] = 2.65^{+0.10}_{-0.09} $](/articles/aa/full_html/2026/01/aa53945-25/aa53945-25-eq15.gif) , a hydrogen column density of
, a hydrogen column density of  cm−2, and an outflowing velocity of
  km s−1. For WAL, these parameters are lower: log[ξ/(erg cm s−1)] = 1.65 ± 0.11,
  cm−2, and
  km s−1. The parameter contour maps of WAH and WAL are shown in Fig. B.1. The WAH mainly produces absorption features of Fe XVIII–XXI lines over 13−17 Å (observer frame), and it also produces the absorption lines of O VIII and Ne IX–X (see Fig. 3). The main absorption features produced by WAL include Fe IX–XI and O VII–VIII over 17−20 Å (observer frame), and other highly ionized lines, for example Ne VIII–X (see Fig. 3). The velocity profiles for six of the above-mentioned absorption lines are shown in Fig. B.2.
4.3. Radial location of warm absorbers in 3C 59
We separately estimated the upper and lower limits for the distance (r) of warm absorbers to the central BH. The upper limit is estimated based on the assumption that the thickness of the absorber cloud (Δr) does not exceed its distance to the BH (Krolik & Kriss 2001; Blustin et al. 2005). Considering that NH ≈ nHΔr, the upper limit of the distance rmax ≈ Δr ≈ NH/nH. Combined with Eq. (1), rmax can be expressed as rmax ≈ Lion/(ξNH). The lower limit of the distance is estimated based on the assumption that the outflowing velocities (vout) of warm absorbers should be higher than the escape velocities  , where G is the gravitational constant (Blustin et al. 2005). Thus, the lower limit of the distance is estimated by rmin = 2GMBH/vout2. According to these definitions, the distance is 25 pc ≲ r ≲ 188 pc for WAH and 135 pc ≲ r ≲ 4 kpc for WAL (see Table 2 and Fig. 5). Here we note that rmin and rmax indicate a rough distance range rather than a true physical scale (Δr) of warm absorbers. The true Δr may be much smaller than its distance to the BH (Sadaula et al. 2023), which is difficult to estimate.
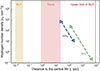 |
Fig. 5. Distance of warm absorbers to the central BH in 3C 59. The solid blue and green lines represent the nH − r distributions for WAH and WAL, respectively. The left and right pointing markers (⊳ and ⊲) denote the lower and upper limits of r, respectively. The orange region means the size of broad (emission-)line region in 3C 59. The red region shows the size of torus in 3C 59. The dotted brown line represents the maximum distance of narrow (emission-)line region to the BH in 3C 59. We refer to Section 4.3 for detailed calculation of these sizes. |
In Fig. 5 we also show the positions of two warm absorbers relative to the broad (emission-)line region (BLR), dust torus, and NLR. The distance of the BLR to the central BH is estimated by its correlation with the AGN continuum luminosity at rest-frame 5100 Å (λ Lλ (5100 Å)), which is ![Mathematical equation: $ \log (R_{\mathrm{BLR}}/\mathrm{ld}) = (1.69 \pm 0.23) + (0.37^{+0.18}_{-0.17})\times \log [\lambda L_{\lambda} (5100\,\AA)/(10^{44}\,\mathrm{erg\,s^{-1}})] $](/articles/aa/full_html/2026/01/aa53945-25/aa53945-25-eq21.gif) (GRAVITY Collaboration 2024). The λ Lλ (5100 Å) of 3C 59 is given by the best-fit total intrinsic continuum model, which is about 3.51 × 1043 erg s−1. Here we do not use the LAMOST spectrum to estimate λ Lλ (5100 Å) because the host galaxy of 3C 59 has a non-negligible contribution at rest-frame 5100 Å, which is difficult to reliably deduct (see details in Section 3.1). The RBLR of 3C 59 is around 0.009−0.03 pc. The inner radius of the dust torus is estimated by Rtorus, in = 0.4 × (Lbol/1045 erg s−1)0.5 × (1500 K/Td)2.6 pc with a dust temperature Td = 1500 K (Nenkova et al. 2008), and the outer radius of the dust torus is assumed to be Rtorus, out ≈ 30Rtorus, in (e.g., Nenkova et al. 2008; Zhou et al. 2024). For 3C 59, Rtorus, in and Rtorus, out is about 0.7 pc and 22 pc, respectively. The distance of the NLR is estimated by its correlation with [OIII] λ5007 Å line luminosity (L[OIII]), which is
(GRAVITY Collaboration 2024). The λ Lλ (5100 Å) of 3C 59 is given by the best-fit total intrinsic continuum model, which is about 3.51 × 1043 erg s−1. Here we do not use the LAMOST spectrum to estimate λ Lλ (5100 Å) because the host galaxy of 3C 59 has a non-negligible contribution at rest-frame 5100 Å, which is difficult to reliably deduct (see details in Section 3.1). The RBLR of 3C 59 is around 0.009−0.03 pc. The inner radius of the dust torus is estimated by Rtorus, in = 0.4 × (Lbol/1045 erg s−1)0.5 × (1500 K/Td)2.6 pc with a dust temperature Td = 1500 K (Nenkova et al. 2008), and the outer radius of the dust torus is assumed to be Rtorus, out ≈ 30Rtorus, in (e.g., Nenkova et al. 2008; Zhou et al. 2024). For 3C 59, Rtorus, in and Rtorus, out is about 0.7 pc and 22 pc, respectively. The distance of the NLR is estimated by its correlation with [OIII] λ5007 Å line luminosity (L[OIII]), which is ![Mathematical equation: $ \log (R_{\mathrm{NLR}}/\mathrm{pc}) = (0.250 \pm 0.018)\times \log [L_{[\rm OIII]}/(10^{42}\,\mathrm{erg\,s^{-1}})] + (3.746 \pm 0.028) $](/articles/aa/full_html/2026/01/aa53945-25/aa53945-25-eq22.gif) (Liu et al. 2013). The L[OIII] is estimated through the spectral fitting with the LAMOST spectrum, which is 6.86 × 1042 erg s−1 (see details in Appendix C). We emphasize that this L[OIII] also includes a star formation-induced contribution that is difficult to separate from the AGN contributions, so here we only used this L[OIII] as an upper limit to estimate the maximum distance of NLR, which is RNLR, max ∼ 9 kpc. As Fig. 5 shows, warm absorbers of 3C 59 are located between the outer torus and NLR. The distances of the BLR, dust torus, and NLR are summarized in Table 2.
(Liu et al. 2013). The L[OIII] is estimated through the spectral fitting with the LAMOST spectrum, which is 6.86 × 1042 erg s−1 (see details in Appendix C). We emphasize that this L[OIII] also includes a star formation-induced contribution that is difficult to separate from the AGN contributions, so here we only used this L[OIII] as an upper limit to estimate the maximum distance of NLR, which is RNLR, max ∼ 9 kpc. As Fig. 5 shows, warm absorbers of 3C 59 are located between the outer torus and NLR. The distances of the BLR, dust torus, and NLR are summarized in Table 2.
4.4. Comparison between different spectral fitting strategies
M19 also found two warm absorbers for 3C 59 (WAH: NH = (0.81 ± 0.08)×1022 cm−2, log[ξ/(erg cm s−1)] = 2.42 ± 0.03, and vout = −1000 ± 120 km s−1; WAL: NH = (0.40 ± 0.02)×1022 cm−2, log[ξ/(erg cm s−1)] = 1.20 ± 0.05, and vout = −3530 ± 130 km s−1). We got significantly different results compared to M19. There are several main differences between our analysis and M19: (1) We additionally used NIR-optical-UV data to constrain the continuum model compared to M19. (2) M19 included EPIC-pn data below 2 keV, while we excluded them. (3) M19 used an accretion disk model (mbb) to describe the emission from optical to soft X-ray bands, while we used both a warm Comptonization component (comt) and a disk model (dbb) to collectively describe these emissions.
The comparison between our results and M19 also reminds us that different spectral fitting strategies may also have a potential impact on the best-fit result, such as whether to incorporate NIR-optical-UV data to constrain the continuum models, the choice of spectral coverage of each instrument, and the composition of SED models. The existence of this issue calls for rigorous caution when comparing or combining results from different works. However, until now, this issue still lacks adequate studies. To check the potential impact of different spectral fitting strategies on the best-fit results, we performed the following two spectral fitting tests: (Test 1) spectral fitting without NIR-optical-UV data and adopting different SED compositions; (Test 2) spectral fitting with the inclusion of the EPIC-pn spectrum in the energy range of 0.3−2 keV.
The spectral fitting strategy of Test 1 differs from that adopted in this work (see details in Section 3) primarily in the exclusion or inclusion of NIR-optical-UV data and the composition of broadband SED. In this test we did not utilize NIR-optical-UV data and adopted the same SED composition (mbb, pow, and refl) as M19. The mbb model is used to describe the emission from optical to soft X-rays bands. The best-fit parameters of warm absorbers of Test 1 are shown as the green triangles in Fig. 6. In a comparison of Test 1 with the spectral fitting strategy adopted in this work (black stars in Fig. 6), the ionization parameters of warm absorbers show a difference. At the 95% confidence level, this difference is statistically significant for WAH and is not statistically significant for WAL. This difference may be mainly due to the different ionizing luminosity caused by the different SED compositions or shapes (the ionizing luminosity given by Test 1 is about 50% of the value shown in Table 1). Further, we found that the AGN fluxes at the g, r, and z filters of the DESI are about 50 times higher than the values predicted by the disk model in Test 1, which indicates that two SED components are essential to fully describe the emission from optical to soft X-ray bands. In conclusion, NIR-optical-UV data are very essential for the construction of broadband SED, which may further affect the estimation of physical properties of warm absorbers.
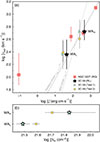 |
Fig. 6. Outflowing velocity (vout) plotted against ionization parameter (ξ) (panel a) and distribution of hydrogen column density (panel b) of a radio-loud (RL) AGN 3C 59. The black stars are the best-fit results obtained by the spectral fitting strategy that we adopted in this work. The symbols with gray edges represent the best-fit results based on different spectral fitting strategies: spectral fitting without NIR-optical-UV data and adopting different SED compositions (Test 1; green triangles) and spectral fitting with inclusion of the EPIC-pn spectrum in the energy range of 0.3−2 keV (Test 2; yellow circles) (see details in Section 4.4). The red squares are the best-fit results for a radio-quiet (RQ) AGN NGC 3227, which are derived from Wang et al. (2022b). The vout − ξ relations of the radiation pressure-driven (dashed gray line) and MHD-driven (dotted gray line) mechanisms are scaled to the average values of WAH and WAL of 3C 59 (two black stars). |
The spectral fitting strategy of Test 2 differs from that adopted in this work primarily in the inclusion or exclusion of EPIC-pn spectra in the energy range of 0.3−2 keV during spectral fitting. In Test 2 we adopted the same broadband SED composition as that described in Section 3. The best-fit parameters of warm absorbers of Test 2 are shown as the yellow circles in Fig. 6. Comparing Test 2 with the spectral fitting strategy adopted in this work (black stars in Fig. 6), we found that the ionization parameters and hydrogen column densities of warm absorbers show differences. At the 95% confidence level, the difference in ionization parameter is statistically significant for WAH and is not statistically significant for WAL, while the differences in hydrogen column density are not statistically significant for WAH or WAL. These differences are mainly due to the different SED shape.
4.5. Driving mechanisms of warm absorbers in 3C 59 and the comparison with radio-quiet AGN NGC 3227
The correlation between the outflowing velocity and the ionization parameter can trace the driving mechanisms of outflows (Tombesi et al. 2013). Based on the assumption that the outflow momentum rate is comparable to the momentum rate of the radiation field (e.g., Gofford et al. 2015), the radiation pressure-driven mechanism predicts that vout ∝ ξ0.5 (Tombesi et al. 2013). According to one of the most profound scaling relations for magnetohydrodynamic (MHD) winds (e.g., Konigl & Pudritz 2000; Pelletier & Pudritz 1992), which shows that the outflow rate of a MHD wind is proportional to the accretion rate, the MHD-driven mechanism predicts that vout ∝ ξ (Tombesi et al. 2013). As Fig. 6 shows, the warm absorbers of 3C 59 appear to be more consistent with the radiation pressure-driven mechanism than the MHD-driven mechanism. Warm absorbers may be mainly dusty winds, for which the radiation pressure-driven mechanism usually plays a crucial role (Yamada et al. 2024). However, Wang et al. (2022a) found that neither the radiation pressure-driven nor MHD-driven mechanisms can fully explain the vout − ξ relation of warm absorbers in the radio-quiet AGNs, especially for the warm absorbers with log[ξ/(erg cm s−1)] < 1. They argued that the pressure equilibrium between the radiation pressure on the warm absorbers and the drag pressure from the ACM can explain the vout − ξ relation well, and they further used the index of the vout − ξ relation to deduce the density profile of the ACM, which implies that the accretion physics in these radio-quiet AGNs follow the standard thin disk model. However, we do not find any reliable warm absorbers with log[ξ/(erg cm s−1)] < 1 for 3C 59, so we cannot make a detailed statistical analysis of the ACM density profile in 3C 59. In the future we will require more high-resolution X-ray spectra with longer exposures to make further analyses.
To compare the driven mechanisms of warm absorber outflows between radio-quiet and radio-loud AGNs, we plot the results of a radio-quiet AGN NGC 3227 from Wang et al. (2022b) in Fig. 6. Wang et al. (2022b) adopted the same spectral fitting strategy for NGC 3227 as that for 3C 59 in this work. For warm absorbers with log[ξ/(erg cm s−1)] > 1, 3C 59 has a generally similar vout − ξ relation to NGC 3227 (see Fig. 6). It demonstrates that at least for warm absorbers with log[ξ/(erg cm s−1)] > 1, radio-quiet AGN NGC 3227 and radio-loud AGN 3C 59 appear to have similar driving mechanisms, and jets may play a negligible role in these processes. However, due to the limited sample size, we cannot extend this conclusion to all the radio-quiet and radio-loud AGNs. Even so, this work present a comparative analysis of outflow driven mechanisms between radio-loud and radio-quiet AGNs. Serving as a pilot study, this work also validates our spectral fitting strategy that will be applied in more radio-quiet and radio-loud AGNs to draw a more statistically robust conclusion.
4.6. Mass outflow rate of warm absorbers in 3C 59
The mass outflow rate of warm absorbers can be estimated by Ṁout ∼ (Ṗabs + Ṗscatt)/vout, where Ṗabs is the momentum of radiation being absorbed by warm absorbers and Ṗscatt is the momentum of radiation being scattered by warm absorbers (Blustin et al. 2005). Here Ṗabs is calculated by Ṗabs = Labs/c, where Labs is the luminosity absorbed by the warm absorber over 1−1000 Ryd, given by the spectral fitting. The Ṗscatt is estimated as  , where τT is the optical depth for Thomson scattering, given by τT = σTNH (σT is the Thomson cross section). The detailed values of Ṗabs and Ṗscatt are summarized in Table 2. The mass outflow rate is around 0.47 M⊙ yr−1 and 3.15 M⊙ yr−1 for WAH and WAL, respectively. The kinetic energy of warm absorbers can be estimated by
  , which is 4.11 × 1040 erg s−1 for WAH and 5.20 × 1040 erg s−1 for WAL. Hopkins & Elvis (2010) found that if ĖK/Lbol of a wind is higher than 0.5%, this wind will have an efficient feedback to the host galaxy. However, for both WAH and WAL, ĖK/Lbol is ∼0.002%, which implies that warm absorbers in 3C 59 do not have a significant feedback to the host galaxy.
5. Summary and conclusion
Based on the multiwavelength data from the NIR to hard X-ray bands detected by DESI, GALEX, and XMM-Newton, we used the spex code to construct intrinsic broadband SEDs and to perform an X-ray spectral analysis for a radio-loud AGN 3C 59 (Figs. 1 and 2). Our results and conclusions are summarized as follows:
According to the best-fit results, we found two warm absorbers for 3C 59, which present significantly different physical properties (Table 1). The high-ionization warm absorber with an ionization parameter of ![Mathematical equation: $ \log[\xi/(\mathrm{erg\,cm\,s^{-1}})] = 2.65^{+0.10}_{-0.09} $](/articles/aa/full_html/2026/01/aa53945-25/aa53945-25-eq25.gif) has a higher column density (
has a higher column density ( cm−2) and a higher outflowing velocity (
 km s−1) than the low-ionization warm absorber (log[ξ/(erg cm s−1)] = 1.65 ± 0.11,
  cm−2, and
  km s−1). These warm absorbers are located between outer torus and narrow (emission-)line region (Table 2 and Fig. 5), while they do not show a significant feedback to the host galaxy.
We found that different spectral fitting strategies, such as the inclusion of NIR to UV data, the choice of energy range of spectrum, or the composition of broadband SED, have an impact on the estimations of physical parameters of warm absorbers (Fig. 6). The existence of this issue also calls for rigorous caution when comparing or combining results from different works.
The positive correlation between vout and ξ of these two warm absorbers can be explained by the radiation pressure-driven mechanism (Fig. 6). In addition, this correlation is almost consistent with that in a radio-quiet AGN NGC 3227 based on the same spectral fitting strategy, which implies that the warm absorber outflows of 3C 59 and NGC 3227 have the same driven mechanisms and that jets may play a negligible role in these processes (Fig. 6). Following this pilot study, we will apply the same spectral fitting strategy in more radio-loud and radio-quiet AGNs to draw a more statistically robust conclusion.
See details in http://svo2.cab.inta-csic.es/theory/fps/
See details in https://www.cosmos.esa.int/web/xmm-newton/sas-threads
The host galaxy of 3C 59 is an elliptical galaxy, but it is experiencing star-formation rejuvenation (see Paper I), which puts 3C 59 in a quite complex host galaxy enviroment.
Based on the reverberation mapping method, the black hole mass of 3C 59 is about 108.9 M⊙ (Wu & Liu 2004), and it is about 109 M⊙ for 3C 382 (Fausnaugh et al. 2017).
The bolometric luminosities, 0.3−10 keV X-ray luminosities, and Eddington ratios of both 3C 59 and 3C 382 are about 4 × 1045 erg s−1, 5 × 1044 erg s−1, and 0.04, respectively (M19).
3C 59 and 3C 382 are both FRII radio-loud AGN.
See details in the spex manual: https://spex-xray.github.io/spex-help/models/hot.html
See the LAMOST website: http://www.lamost.org/public/node/119?locale=en
Acknowledgments
We thank the anonymous referee for the constructive comments that greatly improved this paper. The data and scripts used in this work are available at Zenodo, DOI: 10.5281/zenodo.17292242.. This work was supported by National Natural Science Foundation of China (Grant No. 12403019), Jiangsu Natural Science Foundation (Grant No. BK20241188), National Natural Science Foundation of China (Grant No.12525302, 12173017 and 12141301), Natural Science Foundation of Jiangsu Higher Education Institutions of China (Grant No. BK20250001), National Key R&D Program of China (Grant No. 2023YFA1605600), Scientific Research Innovation Capability Support Project for Young Faculty (Project No. ZYGXQNJSKYCXNLZCXM-P3), the Fundamental Research Funds for the Central Universities with Grant No. KG202502, and the China Manned Space Program with Grant No. CMS-CSST-2025-A04. Z.C. He acknowledges the support of the National Natural Science Foundation of China (Grant Nos. 12222304, 12192220, and 12192221). Y.Q.X. acknowledges support from National Natural Science Foundation of China (Project No. 12025303 and Project No. 12393814). Guoshoujing Telescope (the Large Sky Area Multi-Object Fiber Spectroscopic Telescope LAMOST) is a National Major Scientific Project built by the Chinese Academy of Sciences. Funding for the project has been provided by the National Development and Reform Commission. LAMOST is operated and managed by the National Astronomical Observatories, Chinese Academy of Sciences.
References
- Alexander, K. D., Berger, E., Guillochon, J., Zauderer, B. A., & Williams, P. K. G. 2016, ApJ, 819, L25 [NASA ADS] [CrossRef] [Google Scholar]
- Alexander, K. D., van Velzen, S., Horesh, A., & Zauderer, B. A. 2020, Space Sci. Rev., 216, 81 [CrossRef] [Google Scholar]
- Anderson, M. M., Mooley, K. P., Hallinan, G., et al. 2020, ApJ, 903, 116 [NASA ADS] [CrossRef] [Google Scholar]
- Begelman, M. C., McKee, C. F., & Shields, G. A. 1983, ApJ, 271, 70 [CrossRef] [Google Scholar]
- Blandford, R. D., & Payne, D. G. 1982, MNRAS, 199, 883 [CrossRef] [Google Scholar]
- Blandford, R. D., & Znajek, R. L. 1977, MNRAS, 179, 433 [NASA ADS] [CrossRef] [Google Scholar]
- Blustin, A. J., Page, M. J., Fuerst, S. V., Branduardi-Raymont, G., & Ashton, C. E. 2005, A&A, 431, 111 [CrossRef] [EDP Sciences] [Google Scholar]
- Boehringer, H., Voges, W., Fabian, A. C., Edge, A. C., & Neumann, D. M. 1993, MNRAS, 264, L25 [NASA ADS] [CrossRef] [Google Scholar]
- Bondi, H. 1952, MNRAS, 112, 195 [Google Scholar]
- Boquien, M., Burgarella, D., Roehlly, Y., et al. 2019, A&A, 622, A103 [NASA ADS] [CrossRef] [EDP Sciences] [Google Scholar]
- Burgarella, D., Buat, V., & Iglesias-Páramo, J. 2005, MNRAS, 360, 1413 [NASA ADS] [CrossRef] [Google Scholar]
- Cash, W. 1979, ApJ, 228, 939 [Google Scholar]
- Di Gesu, L., & Costantini, E. 2016, A&A, 594, A88 [NASA ADS] [CrossRef] [EDP Sciences] [Google Scholar]
- Ding, X., Birrer, S., Treu, T., & Silverman, J. D. 2021, ArXiv e-prints [arXiv:2111.08721] [Google Scholar]
- Eftekhari, T., Berger, E., Zauderer, B. A., Margutti, R., & Alexander, K. D. 2018, ApJ, 854, 86 [Google Scholar]
- Eracleous, M., & Halpern, J. P. 2004, ApJS, 150, 181 [NASA ADS] [CrossRef] [Google Scholar]
- Fabian, A. C. 2012, ARA&A, 50, 455 [Google Scholar]
- Fabian, A. C., Sanders, J. S., Taylor, G. B., et al. 2006, MNRAS, 366, 417 [NASA ADS] [CrossRef] [Google Scholar]
- Fausnaugh, M. M., Grier, C. J., Bentz, M. C., et al. 2017, ApJ, 840, 97 [NASA ADS] [CrossRef] [Google Scholar]
- Fiore, F., Feruglio, C., Shankar, F., et al. 2017, A&A, 601, A143 [NASA ADS] [CrossRef] [EDP Sciences] [Google Scholar]
- Fitzpatrick, E. L. 1999, PASP, 111, 63 [Google Scholar]
- Frank, J., King, A., & Raine, D. J. 2002, Accretion Power in Astrophysics: Third Edition (Cambridge: Cambridge University Press) [Google Scholar]
- Fukumura, K., Kazanas, D., Contopoulos, I., & Behar, E. 2010, ApJ, 715, 636 [NASA ADS] [CrossRef] [Google Scholar]
- Gillessen, S., Plewa, P. M., Widmann, F., et al. 2019, ApJ, 871, 126 [NASA ADS] [CrossRef] [Google Scholar]
- Gofford, J., Reeves, J. N., McLaughlin, D. E., et al. 2015, MNRAS, 451, 4169 [Google Scholar]
- GRAVITY Collaboration (Amorim, A., et al.) 2024, A&A, 684, A167 [NASA ADS] [CrossRef] [EDP Sciences] [Google Scholar]
- Guo, H., Shen, Y., & Wang, S. 2018, Astrophysics Source Code Library [record ascl:1809.008] [Google Scholar]
- Holt, J., Tadhunter, C., Morganti, R., et al. 2006, MNRAS, 370, 1633 [NASA ADS] [CrossRef] [Google Scholar]
- Holt, J., Tadhunter, C. N., & Morganti, R. 2008, MNRAS, 387, 639 [NASA ADS] [CrossRef] [Google Scholar]
- Hopkins, P. F., & Elvis, M. 2010, MNRAS, 401, 7 [NASA ADS] [CrossRef] [Google Scholar]
- Kaastra, J. S. 2017, A&A, 605, A51 [NASA ADS] [CrossRef] [EDP Sciences] [Google Scholar]
- Kaastra, J. S., & Bleeker, J. A. M. 2016, A&A, 587, A151 [NASA ADS] [CrossRef] [EDP Sciences] [Google Scholar]
- Kaastra, J. S., Mewe, R., & Nieuwenhuijzen, H. 1996, in UV and X-ray Spectroscopy of Astrophysical and Laboratory Plasmas, eds. K. Yamashita, & T. Watanabe, 411 [Google Scholar]
- Kaastra, J. S., Mewe, R., Liedahl, D. A., Komossa, S., & Brinkman, A. C. 2000, A&A, 354, L83 [NASA ADS] [Google Scholar]
- Kaastra, J. S., Detmers, R. G., Mehdipour, M., et al. 2012, A&A, 539, A117 [NASA ADS] [CrossRef] [EDP Sciences] [Google Scholar]
- Kaastra, J. S., Raassen, A. J. J., de Plaa, J., & Gu, L. 2024, https://doi.org/10.5281/zenodo.6948884 [Google Scholar]
- Kang, J., Wang, J., & Kang, W. 2020, ApJ, 901, 111 [CrossRef] [Google Scholar]
- Kayanoki, T., Mao, J., & Fukazawa, Y. 2024, MNRAS, 528, 4504 [CrossRef] [Google Scholar]
- King, A., & Pounds, K. 2015, ARA&A, 53, 115 [NASA ADS] [CrossRef] [Google Scholar]
- Konigl, A., & Kartje, J. F. 1994, ApJ, 434, 446 [NASA ADS] [CrossRef] [Google Scholar]
- Konigl, A., & Pudritz, R. E. 2000, in Protostars and Planets IV, eds. V. Mannings, A. P. Boss, & S. S. Russell, 759 [Google Scholar]
- Krolik, J. H., & Kriss, G. A. 1995, ApJ, 447, 512 [NASA ADS] [CrossRef] [Google Scholar]
- Krolik, J. H., & Kriss, G. A. 2001, ApJ, 561, 684 [CrossRef] [Google Scholar]
- Krongold, Y., Nicastro, F., Elvis, M., et al. 2007, ApJ, 659, 1022 [NASA ADS] [CrossRef] [Google Scholar]
- Laha, S., Guainazzi, M., Dewangan, G. C., Chakravorty, S., & Kembhavi, A. K. 2014, MNRAS, 441, 2613 [NASA ADS] [CrossRef] [Google Scholar]
- Laha, S., Reynolds, C. S., Reeves, J., et al. 2021, Nat. Astron., 5, 13 [NASA ADS] [CrossRef] [Google Scholar]
- Liu, G., Zakamska, N. L., Greene, J. E., Nesvadba, N. P. H., & Liu, X. 2013, MNRAS, 430, 2327 [NASA ADS] [CrossRef] [Google Scholar]
- Mao, J., Mehdipour, M., Kaastra, J. S., et al. 2019, A&A, 621, A99 [NASA ADS] [CrossRef] [EDP Sciences] [Google Scholar]
- Mao, J., Kriss, G. A., Landt, H., et al. 2022a, ApJ, 940, 41 [NASA ADS] [CrossRef] [Google Scholar]
- Mao, J., Kaastra, J. S., Mehdipour, M., et al. 2022b, A&A, 665, A72 [NASA ADS] [CrossRef] [EDP Sciences] [Google Scholar]
- Matzeu, G. A., Brusa, M., Lanzuisi, G., et al. 2023, A&A, 670, A182 [Google Scholar]
- Mehdipour, M., & Costantini, E. 2019, A&A, 625, A25 [NASA ADS] [CrossRef] [EDP Sciences] [Google Scholar]
- Mehdipour, M., Kaastra, J. S., & Kallman, T. 2016, A&A, 596, A65 [NASA ADS] [CrossRef] [EDP Sciences] [Google Scholar]
- Mehdipour, M., Kaastra, J. S., Costantini, E., et al. 2018, A&A, 615, A72 [NASA ADS] [CrossRef] [EDP Sciences] [Google Scholar]
- Mehdipour, M., Kriss, G. A., Kaastra, J. S., et al. 2021, A&A, 652, A150 [NASA ADS] [CrossRef] [EDP Sciences] [Google Scholar]
- Miller, M. J., & Bregman, J. N. 2015, ApJ, 800, 14 [NASA ADS] [CrossRef] [Google Scholar]
- Mizumoto, M., Done, C., Tomaru, R., & Edwards, I. 2019, MNRAS, 489, 1152 [NASA ADS] [CrossRef] [Google Scholar]
- Morrissey, P., Conrow, T., Barlow, T. A., et al. 2007, ApJS, 173, 682 [Google Scholar]
- Narayan, R., & Yi, I. 1994, ApJ, 428, L13 [Google Scholar]
- Nenkova, M., Sirocky, M. M., Nikutta, R., Ivezić, Ž., & Elitzur, M. 2008, ApJ, 685, 160 [Google Scholar]
- Noll, S., Burgarella, D., Giovannoli, E., et al. 2009, A&A, 507, 1793 [NASA ADS] [CrossRef] [EDP Sciences] [Google Scholar]
- Pelletier, G., & Pudritz, R. E. 1992, ApJ, 394, 117 [NASA ADS] [CrossRef] [Google Scholar]
- Peralta de Arriba, L., Alonso-Herrero, A., García-Burillo, S., et al. 2023, A&A, 675, A58 [NASA ADS] [CrossRef] [EDP Sciences] [Google Scholar]
- Proga, D., & Kallman, T. R. 2004, ApJ, 616, 688 [Google Scholar]
- Reeves, J. N., Sambruna, R. M., Braito, V., & Eracleous, M. 2009, ApJ, 702, L187 [Google Scholar]
- Reeves, J. N., Gofford, J., Braito, V., & Sambruna, R. 2010, ApJ, 725, 803 [Google Scholar]
- Reynolds, C. S. 1997, MNRAS, 286, 513 [NASA ADS] [CrossRef] [Google Scholar]
- Russell, H. R., Fabian, A. C., McNamara, B. R., & Broderick, A. E. 2015, MNRAS, 451, 588 [NASA ADS] [CrossRef] [Google Scholar]
- Rybicki, G. B., & Lightman, A. P. 1979, Radiative Processes in Astrophysics (New York: Wiley) [Google Scholar]
- Sadaula, D. R., Bautista, M. A., García, J. A., & Kallman, T. R. 2023, ApJ, 946, 93 [NASA ADS] [CrossRef] [Google Scholar]
- Schlegel, D. J., Finkbeiner, D. P., & Davis, M. 1998, ApJ, 500, 525 [Google Scholar]
- Shen, Y., Hall, P. B., Horne, K., et al. 2019, ApJS, 241, 34 [NASA ADS] [CrossRef] [Google Scholar]
- Silva, C. V., Uttley, P., & Costantini, E. 2016, A&A, 596, A79 [NASA ADS] [CrossRef] [EDP Sciences] [Google Scholar]
- Singha, M., O’Dea, C. P., & Baum, S. A. 2023, Galaxies, 11, 85 [NASA ADS] [CrossRef] [Google Scholar]
- Tadhunter, C., Wills, K., Morganti, R., Oosterloo, T., & Dickson, R. 2001, MNRAS, 327, 227 [CrossRef] [Google Scholar]
- Tarter, C. B., Tucker, W. H., & Salpeter, E. E. 1969, ApJ, 156, 943 [Google Scholar]
- Tombesi, F., Cappi, M., Reeves, J. N., et al. 2013, MNRAS, 430, 1102 [Google Scholar]
- Tombesi, F., Tazaki, F., Mushotzky, R. F., et al. 2014, MNRAS, 443, 2154 [NASA ADS] [CrossRef] [Google Scholar]
- Torresi, E., Grandi, P., Longinotti, A. L., et al. 2010, MNRAS, 401, L10 [Google Scholar]
- Torresi, E., Grandi, P., Costantini, E., & Palumbo, G. G. C. 2012, MNRAS, 419, 321 [Google Scholar]
- Ursini, F., Petrucci, P. O., Matt, G., et al. 2018, MNRAS, 478, 2663 [NASA ADS] [CrossRef] [Google Scholar]
- Véron-Cetty, M. P., & Véron, P. 2010, A&A, 518, A10 [Google Scholar]
- Wang, Y., He, Z., Mao, J., et al. 2022a, ApJ, 928, 7 [NASA ADS] [CrossRef] [Google Scholar]
- Wang, Y., Kaastra, J., Mehdipour, M., et al. 2022b, A&A, 657, A77 [NASA ADS] [CrossRef] [EDP Sciences] [Google Scholar]
- Wang, Y., Wang, T., Xu, K., et al. 2025, ApJ, 980, 107 [Google Scholar]
- Wong, K.-W., Irwin, J. A., Yukita, M., et al. 2011, ApJ, 736, L23 [NASA ADS] [CrossRef] [Google Scholar]
- Wu, X.-B., & Liu, F. K. 2004, ApJ, 614, 91 [NASA ADS] [CrossRef] [Google Scholar]
- Yamada, S., Kawamuro, T., Mizumoto, M., et al. 2024, ApJS, 274, 8 [NASA ADS] [CrossRef] [Google Scholar]
- Yang, G., Boquien, M., Buat, V., et al. 2020, MNRAS, 491, 740 [Google Scholar]
- Yang, G., Boquien, M., Brandt, W. N., et al. 2022, ApJ, 927, 192 [NASA ADS] [CrossRef] [Google Scholar]
- Yuan, F., & Narayan, R. 2014, ARA&A, 52, 529 [NASA ADS] [CrossRef] [Google Scholar]
- Zhou, Z., Mao, J., Fang, T., et al. 2024, ApJ, 967, 105 [NASA ADS] [CrossRef] [Google Scholar]
Appendix A: X-ray spectral analysis with three pion models
In Table A.1, we show the spectral fitting with three pion models. The spectral fitting improves with ΔC ∼ 10.4 comparing to that with two pion models (see Table 1). The WAH and WAL have similar physical parameters to those in the spectral fitting with two pion models, and the third pion model may describe another absorber component. This component shows a much lower column density of NH ∼ 1020.2 cm−1 and a much lower ionization parameter of log[ξ/(erg cm s−1)] ∼ −0.88 than WAH and WAL. Due to the large uncertainties for the outflowing velocity of this component, we cannot draw a solid conclusion about whether it is another warm absorber or not. In addition, the spectral fitting improves slightly with the addition of the third pion model, so we do not take it into account in this work (see Section 4.2).
Best-fit results with three pion models for 3C 59
Appendix B: Parameter contour maps of warm absorbers and velocity profiles of absorption lines
Figure B.1 shows the parameter contour maps of warm absorbers with confidence level from 68.3% (1σ) to 99.99% (5σ). Figure 3 illustrates the main absorption lines produced by the two warm absorbers on the RGS spectrum, while in Fig. B.2, we show the velocity profiles for six of these absorption lines. At the outflowing velocities of the two warm absorbers, the velocity profiles exhibit significant absorption features.
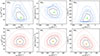 |
Fig. B.1. Contour maps of WAH (upper panels) and WAL (lower panels). The first column indicates outflowing velocity (vout) vs. hydrogen column density (NH). The second column indicates vout vs. ionization parameter (ξ). The third column indicates vout vs. turbulent velocity (σv). The green and orange stars show the best-fit parameters for WAH and WAL, respectively. The solid lines in gradient colors from dark to light represent the 68.3% (1σ), 90% (2σ), 95.4% (3σ), 99% (4σ), and 99.99% (5σ) confidence levels. |
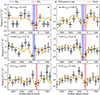 |
Fig. B.2. Velocity profiles for the Ne X (panel a), Ne VIII (panel b), Fe XVIII (panel c), O VIII (panel d), Fe X (panel e), and Fe IX (panel f) absorption lines. λlab stands for laboratory wavelength. The black symbols represent the observed RGS spectrum data with 1σ uncertainties. The solid orange lines denote the best-fit model with spex. The blue and red lines correspond to the outflowing velocities of WAH and WAL, respectively, while the blue and red regions imply their respective 1σ uncertainties. |
Appendix C: Optical spectral fitting with LAMOST spectrum
The detailed spectral fitting for the LAMOST spectrum of 3C 59 was performed with PyQSOFit code (Shen et al. 2019; Guo et al. 2018) (see Fig. C.1). Given that we are only concerned with the [OIII] λ5007 Å emission line luminosity in this work, we just used a simple continuum model that includes a power-law model and a polynomial model accounting for the dust reddening. The broad and narrow components of emission lines were modeled by multiple Gaussian models. Each LAMOST spectrum covers the NIR-optical range from 3700 Å to 9000 Å, which consists of a blue (3700–5900 Å) and a red spectrograph arms (5700−9000 Å).8 In order to estimate the [OIII] λ5007 Å line luminosity for 3C 59, we only utilize the blue-arm spectrum data in this work. The original LAMOST spectrum was only performed with relative flux calibration rather than absolute flux calibration. Therefore, in this work, we utilized the recalibrated LAMOST spectrum from Paper I, which is calibrated through matching with SDSS photometric data (see details in Paper I). In addition, the LAMOST spectrum of 3C 59 had been corrected with the Galactic extinction and the intrinsic extinction from the host galaxy (see detailed introduction about the extinction corrections in Section 2.1).
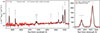 |
Fig. C.1. LAMOST optical spectrum of 3C 59 and spectral fitting results with PyQSOFit code. Left panel: LAMOST spectrum data (solid red line). The dashed blue line denotes the best-fit continuum model including power-law model and polynomial model accounting for the dust reddening. The solid black line is the continuum model plus emission line models that are labeled by the gray lines. Right panel: Spectrum data minus the continuum model (solid red line). The solid black line represents the emission line models. |
All Tables
All Figures
|
Fig. 1. XMM-Newton spectra and the best-fit model with spex. The red points denote the RGS spectrum and the blue points represent the EPIC-pn spectrum. The solid black curve shows the best-fit model. For visualization purposes, here the RGS spectrum is binned by a factor of 10. |
| In the text | |
|
Fig. 2. Best-fit intrinsic SED models. The dotted orange line represents an accretion disk blackbody component (dbb). The dash-dotted green line denotes a warm Comptonization component (comt). The dashed blue line means an X-ray power-law component (pow). The dash-dotted red line shows a neutral X-ray reflection component (refl). The solid black line represents the total best-fit continuum model. |
| In the text | |
|
Fig. 3. 13−20 Å RGS spectrum with main absorption features produced by the warm absorbers of 3C 59. The black points represent the RGS spectrum and the solid orange line denotes the best-fit model. The dashed blue lines and dotted red lines are the main absorption lines produced by the high-ionization warm absorber (WAH) and the low-ionization warm absorber (WAL), respectively. |
| In the text | |
|
Fig. 4. Residual of spectral fitting with different models. The residual (D-M)/E stands for (data–model)/error. Top panel: Spectral fitting with only continuum models and the Galactic absorptions. Middle panel: Spectral fitting after adding the first pion model on the models shown in the top panel. This pion model is used to model the high-ionization warm absorber. The ΔC here means the C-stat differential between the spectral fitting results in the top and middle panels. Bottom panel: Spectral fitting after adding the second pion model on the models shown in the middle panel. This pion model is used to model the low-ionization warm absorber. The ΔC here means the C-stat differential between the spectral fitting results in the middle and bottom panels. |
| In the text | |
|
Fig. 5. Distance of warm absorbers to the central BH in 3C 59. The solid blue and green lines represent the nH − r distributions for WAH and WAL, respectively. The left and right pointing markers (⊳ and ⊲) denote the lower and upper limits of r, respectively. The orange region means the size of broad (emission-)line region in 3C 59. The red region shows the size of torus in 3C 59. The dotted brown line represents the maximum distance of narrow (emission-)line region to the BH in 3C 59. We refer to Section 4.3 for detailed calculation of these sizes. |
| In the text | |
|
Fig. 6. Outflowing velocity (vout) plotted against ionization parameter (ξ) (panel a) and distribution of hydrogen column density (panel b) of a radio-loud (RL) AGN 3C 59. The black stars are the best-fit results obtained by the spectral fitting strategy that we adopted in this work. The symbols with gray edges represent the best-fit results based on different spectral fitting strategies: spectral fitting without NIR-optical-UV data and adopting different SED compositions (Test 1; green triangles) and spectral fitting with inclusion of the EPIC-pn spectrum in the energy range of 0.3−2 keV (Test 2; yellow circles) (see details in Section 4.4). The red squares are the best-fit results for a radio-quiet (RQ) AGN NGC 3227, which are derived from Wang et al. (2022b). The vout − ξ relations of the radiation pressure-driven (dashed gray line) and MHD-driven (dotted gray line) mechanisms are scaled to the average values of WAH and WAL of 3C 59 (two black stars). |
| In the text | |
|
Fig. B.1. Contour maps of WAH (upper panels) and WAL (lower panels). The first column indicates outflowing velocity (vout) vs. hydrogen column density (NH). The second column indicates vout vs. ionization parameter (ξ). The third column indicates vout vs. turbulent velocity (σv). The green and orange stars show the best-fit parameters for WAH and WAL, respectively. The solid lines in gradient colors from dark to light represent the 68.3% (1σ), 90% (2σ), 95.4% (3σ), 99% (4σ), and 99.99% (5σ) confidence levels. |
| In the text | |
|
Fig. B.2. Velocity profiles for the Ne X (panel a), Ne VIII (panel b), Fe XVIII (panel c), O VIII (panel d), Fe X (panel e), and Fe IX (panel f) absorption lines. λlab stands for laboratory wavelength. The black symbols represent the observed RGS spectrum data with 1σ uncertainties. The solid orange lines denote the best-fit model with spex. The blue and red lines correspond to the outflowing velocities of WAH and WAL, respectively, while the blue and red regions imply their respective 1σ uncertainties. |
| In the text | |
|
Fig. C.1. LAMOST optical spectrum of 3C 59 and spectral fitting results with PyQSOFit code. Left panel: LAMOST spectrum data (solid red line). The dashed blue line denotes the best-fit continuum model including power-law model and polynomial model accounting for the dust reddening. The solid black line is the continuum model plus emission line models that are labeled by the gray lines. Right panel: Spectrum data minus the continuum model (solid red line). The solid black line represents the emission line models. |
| In the text | |
Current usage metrics show cumulative count of Article Views (full-text article views including HTML views, PDF and ePub downloads, according to the available data) and Abstracts Views on Vision4Press platform.
Data correspond to usage on the plateform after 2015. The current usage metrics is available 48-96 hours after online publication and is updated daily on week days.
Initial download of the metrics may take a while.