Fig. B.1.
Download original image
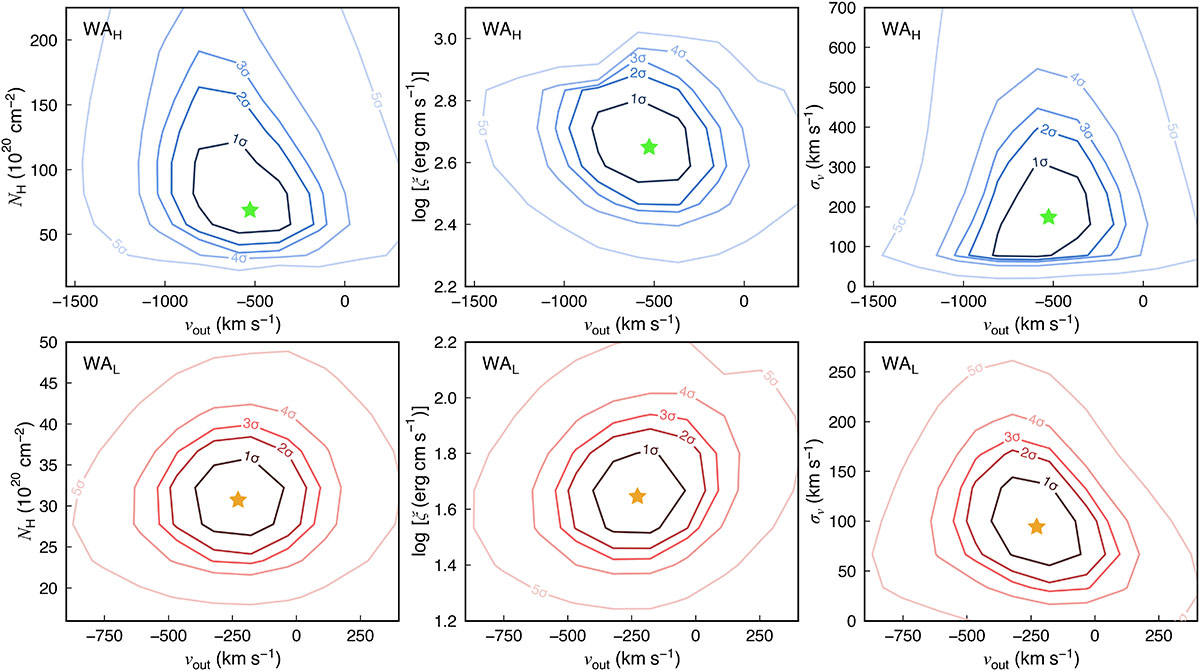
Contour maps of WAH (upper panels) and WAL (lower panels). The first column indicates outflowing velocity (vout) vs. hydrogen column density (NH). The second column indicates vout vs. ionization parameter (ξ). The third column indicates vout vs. turbulent velocity (σv). The green and orange stars show the best-fit parameters for WAH and WAL, respectively. The solid lines in gradient colors from dark to light represent the 68.3% (1σ), 90% (2σ), 95.4% (3σ), 99% (4σ), and 99.99% (5σ) confidence levels.
Current usage metrics show cumulative count of Article Views (full-text article views including HTML views, PDF and ePub downloads, according to the available data) and Abstracts Views on Vision4Press platform.
Data correspond to usage on the plateform after 2015. The current usage metrics is available 48-96 hours after online publication and is updated daily on week days.
Initial download of the metrics may take a while.