Fig. B.2.
Download original image
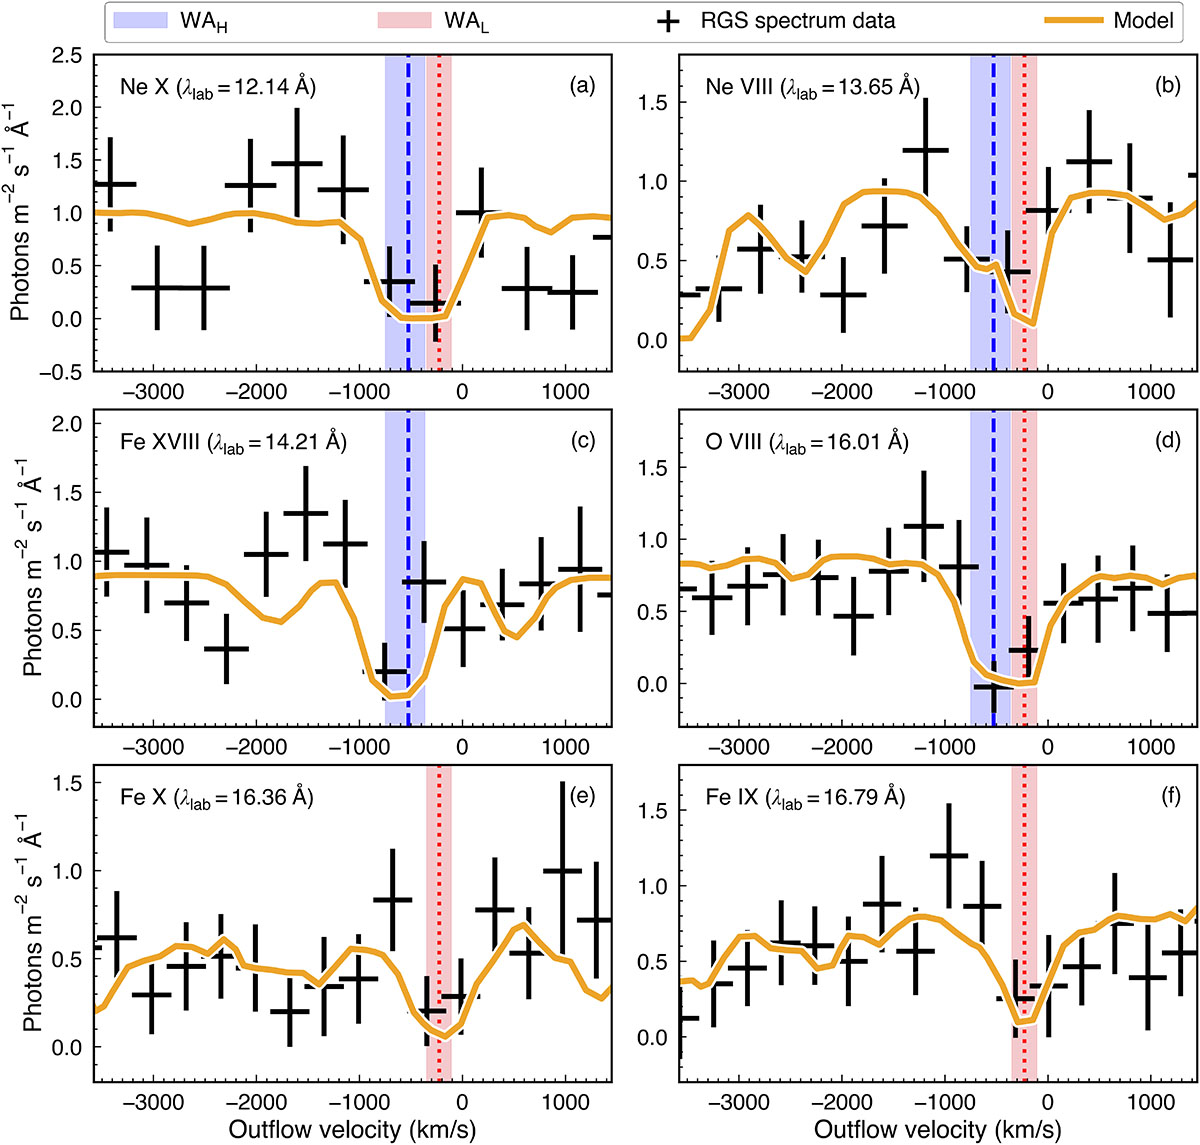
Velocity profiles for the Ne X (panel a), Ne VIII (panel b), Fe XVIII (panel c), O VIII (panel d), Fe X (panel e), and Fe IX (panel f) absorption lines. λlab stands for laboratory wavelength. The black symbols represent the observed RGS spectrum data with 1σ uncertainties. The solid orange lines denote the best-fit model with spex. The blue and red lines correspond to the outflowing velocities of WAH and WAL, respectively, while the blue and red regions imply their respective 1σ uncertainties.
Current usage metrics show cumulative count of Article Views (full-text article views including HTML views, PDF and ePub downloads, according to the available data) and Abstracts Views on Vision4Press platform.
Data correspond to usage on the plateform after 2015. The current usage metrics is available 48-96 hours after online publication and is updated daily on week days.
Initial download of the metrics may take a while.