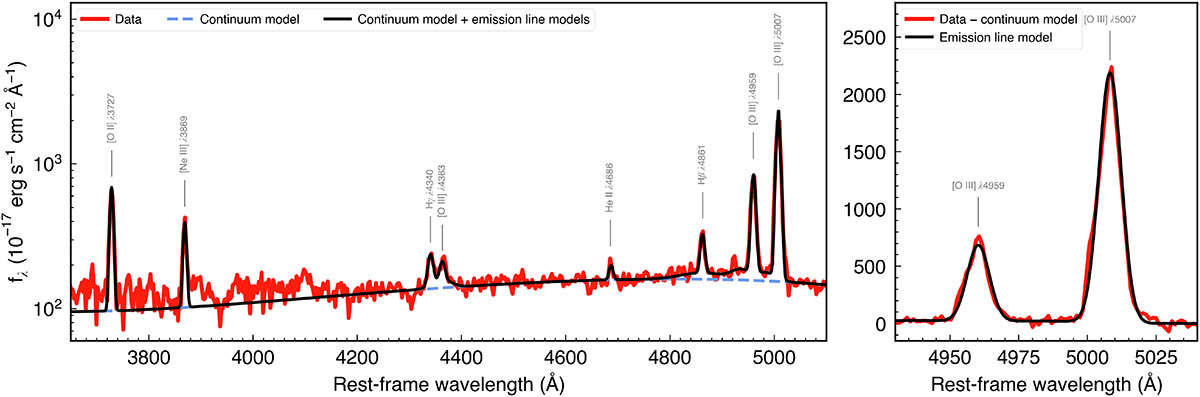
Fig. C.1.
Download original image
LAMOST optical spectrum of 3C 59 and spectral fitting results with PyQSOFit code. Left panel: LAMOST spectrum data (solid red line). The dashed blue line denotes the best-fit continuum model including power-law model and polynomial model accounting for the dust reddening. The solid black line is the continuum model plus emission line models that are labeled by the gray lines. Right panel: Spectrum data minus the continuum model (solid red line). The solid black line represents the emission line models.
Current usage metrics show cumulative count of Article Views (full-text article views including HTML views, PDF and ePub downloads, according to the available data) and Abstracts Views on Vision4Press platform.
Data correspond to usage on the plateform after 2015. The current usage metrics is available 48-96 hours after online publication and is updated daily on week days.
Initial download of the metrics may take a while.