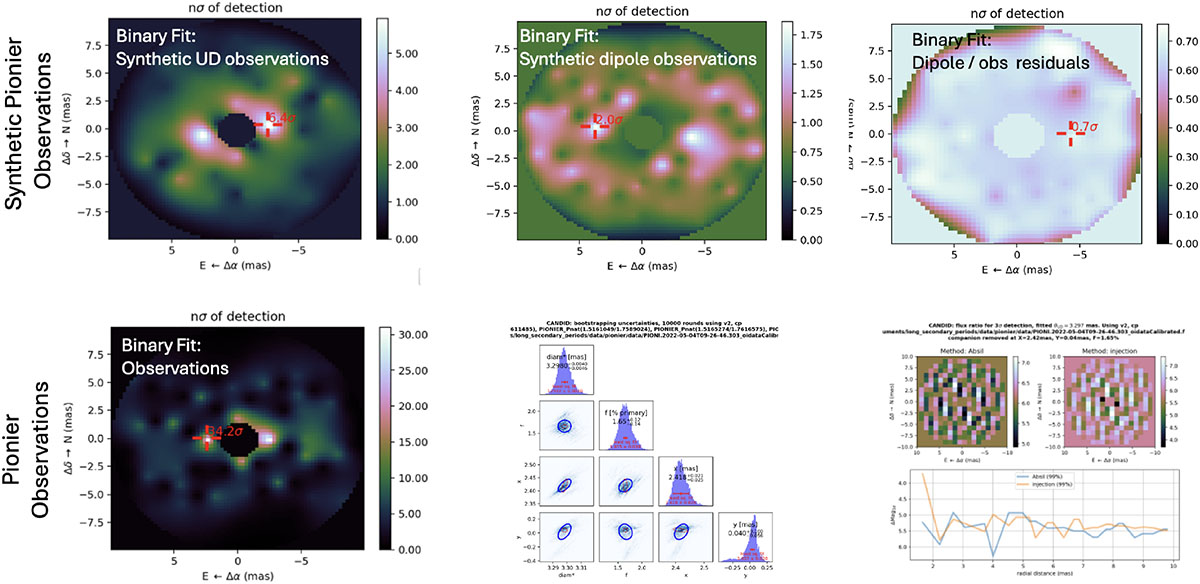
Fig. C.1.
Download original image
PIONIER Fit Maps using CANDID (Gallenne et al. 2015). The top row shows fits to synthetic PIONIER observations of UD, oscillatory convective dipole (keeping the respective observed uncertainties), and residuals of the oscillatory convective dipole model with real observations. The bottom row shows the binary fit to the real data along with parameter distributions from bootstrapping and detection limit estimates.
Current usage metrics show cumulative count of Article Views (full-text article views including HTML views, PDF and ePub downloads, according to the available data) and Abstracts Views on Vision4Press platform.
Data correspond to usage on the plateform after 2015. The current usage metrics is available 48-96 hours after online publication and is updated daily on week days.
Initial download of the metrics may take a while.