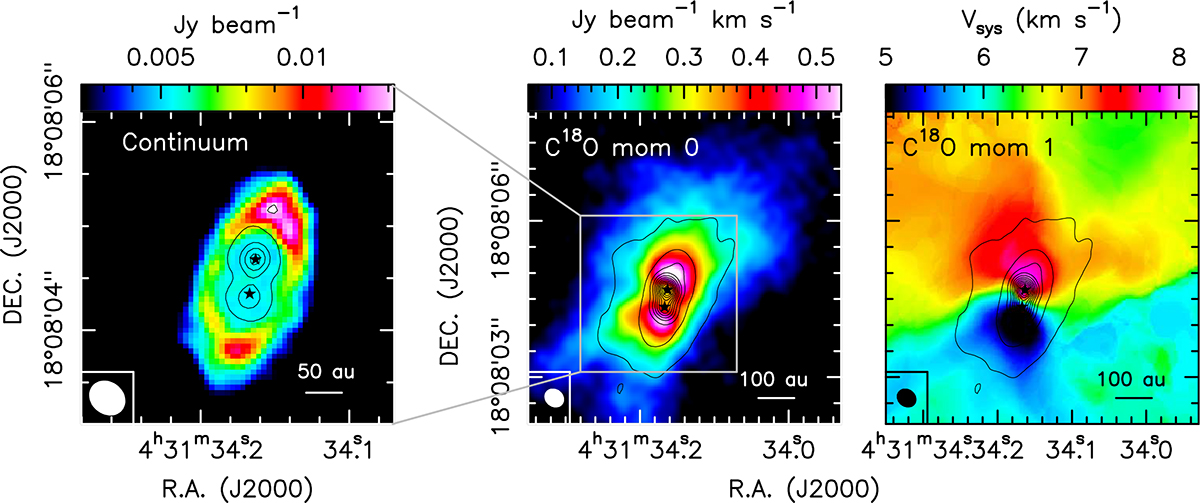
Fig. 1.
Download original image
Left: Continuum emission at 1.33 mm in colour scale (see Sect. 2). The contours indicate the protostellar discs, subtracted from the image during the cleaning process. The first contours and steps are 30σ (13 mJy beam−1) and 100σ, respectively. The black stars indicate the positions of the N and S protostars. Middle: Moment 0 map of the C18O emission (integrated between −10 km s−1 and +20 km s−1) in colour scale superposed to the 1.3 mm dust continuum emission in grey contours (from Bianchi et al. 2020). The first contours and steps are 10σ (1.8 mJy beam−1) and 100σ, respectively. Right: Moment 1 map of the C18O emission in colour scale, 1.3 mm dust continuum emission in grey contours. The moment 1 map is generated using a threshold of 5σ (20 mJy beam−1). The source systemic velocity (vsys) is 6.4 km s−1 (Mercimek et al. 2022).
Current usage metrics show cumulative count of Article Views (full-text article views including HTML views, PDF and ePub downloads, according to the available data) and Abstracts Views on Vision4Press platform.
Data correspond to usage on the plateform after 2015. The current usage metrics is available 48-96 hours after online publication and is updated daily on week days.
Initial download of the metrics may take a while.