| Issue |
A&A
Volume 705, January 2026
|
|
|---|---|---|
| Article Number | L16 | |
| Number of page(s) | 7 | |
| Section | Letters to the Editor | |
| DOI | https://doi.org/10.1051/0004-6361/202554082 | |
| Published online | 14 January 2026 | |
Letter to the Editor
FAUST
XXX. Dust enhancement in the young binary L1551 IRS 5
1
Univ. Grenoble Alpes, CNRS, IPAG 38000 Grenoble, France
2
INAF, Osservatorio Astrofisico di Arcetri Largo E. Fermi 5 I-50125 Firenze, Italy
3
Excellence Cluster ORIGINS Boltzmannstraße 2 D-85748 Garching bei München, Germany
4
Instituto de Radioastronomía y Astrofísica, Universidad Nacional Autónoma de México, A.P. 3-72 (Xangari) 8701 Morelia, Mexico
5
Max-Planck-Institut für extraterrestrische Physik (MPE) Gießenbachstr. 1 D-85741 Garching, Germany
6
National Radio Astronomy Observatory PO Box O Socorro NM 87801, USA
7
RIKEN Cluster for Pioneering Research, 2-1, Hirosawa, Wako-shi Saitama 351-0198, Japan
8
ESO Karl Schwarzchild Srt. 2 85478 Garching bei München, Germany
9
NRC Herzberg Astronomy and Astrophysics 5071 West Saanich Road Victoria BC V9E 2E7, Canada
10
Department of Physics and Astronomy, University of Victoria Victoria BC V8P 5C2, Canada
11
Center for Frontier Science, Chiba University, 1-33 Yayoi-cho Inage-ku Chiba 263-8522, Japan
12
Centro de Astrobiología (CSIC/INTA), Ctra. de Torrejón a Ajalvir km 4 28806 Torrejón de Ardoz, Spain
13
SOKENDAI, Shonan Village, Hayama Kanagawa 240-0193, Japan
★ Corresponding author: This email address is being protected from spambots. You need JavaScript enabled to view it.
Received:
8
February
2025
Accepted:
10
December
2025
Abstract
Young binary stars with discs provide unique laboratories for studying the earliest stages of planet formation in star-forming environments. The detection of substructure in discs around Class I protostars challenges current models of disc evolution, and suggests that planets may form earlier than previously expected (< 1 Myr). In the context of the FAUST Large Program, we present observations of the circumbinary disc (CBD) around the young binary system L1551 IRS 5. The CBD exhibits two prominent over-densities in the continuum emission at the edge of the cavity, with the northern over-density being about 20% brighter than the southern one. By analysing the disc morphology and kinematics of L1551 IRS 5, we delineate dynamical constraints on the binary’s orbital parameters. Additionally, we present 3D hydrodynamical models of the CBD to predict both the dust and the gas surface densities. Then, we compare the resulting synthetic observations with ALMA observations of the continuum emission at 1.3 mm and the C18O line emission. Our analysis suggests that the density enhancements observed with ALMA in L1551 IRS 5 can be caused by interactions between the binary stars and the CBD, leading to dust concentration within the disc. We conclude that the observed over-density corresponds to a location where solids could potentially grow in size under favourable conditions.
Key words: protoplanetary disks / binaries: general / circumstellar matter / stars: kinematics and dynamics / stars: pre-main sequence / stars: protostars
© The Authors 2026
 Open Access article, published by EDP Sciences, under the terms of the Creative Commons Attribution License (https://creativecommons.org/licenses/by/4.0), which permits unrestricted use, distribution, and reproduction in any medium, provided the original work is properly cited.
This article is published in open access under the Subscribe to Open model. This email address is being protected from spambots. You need JavaScript enabled to view it. to support open access publication.
1. Introduction
The process of star formation is intimately linked with the emergence of binary star systems with discs (Duchêne & Kraus 2013). The collapse of a molecular cloud under its own gravity triggers the formation of protostars with surrounding discs made of gas and dust (Bate 2018; Lebreuilly et al. 2021; Kuruwita & Haugbølle 2023). This process naturally leads to a high fraction of young multiple stellar systems where the stars orbit around each other (Reipurth et al. 2014; Offner et al. 2023). The complex interplay between gravity and radiation explains the large variety of structures observed in discs around young stars (Tobin et al. 2016, 2022). In this context, the study of binaries with discs, through observations and through simulations, is crucial in order to reveal where, how, and when planets could form around young stars.
The advent of a new generation of telescopes, such as the Atacama Large Millimeter/submillimeter Array (ALMA), enabled the detection of asymmetric millimetre continuum emission around several million-year-old stellar systems. The systems IRS 48 (van der Marel et al. 2013; Calcino et al. 2019), IRAS04158+2805 (Villenave et al. 2020; Ragusa et al. 2021), and HD 142527 (Casassus et al. 2015; Price et al. 2018a) constitute prototypical examples of horseshoe-shaped asymmetries in circumbinary discs (CBDs). These over-densities of millimetric dust can be explained by the periodic forcing of an inner binary. This mechanism translates into a localised pile-up of material at the inner edge of the disc (e.g. Ragusa et al. 2017; Thun et al. 2017; Poblete et al. 2019; Hirsh et al. 2020. However, not all azimuthal asymmetries correspond to long-lived dust traps; some are transient gas over-densities at the apocentre of eccentric discs, while others reflect short-lived clumps produced by dynamical perturbations (Ragusa et al. 2020). Hence, it is important to distinguish between persistent pressure maxima (causing dust traffic jams) and transient circumbinary structures.
These binary-induced over-densities can either orbit at the local Keplerian frequency or precess on secular timescales of a few hundred binary orbital periods (Ragusa et al. 2020; Muñoz & Lithwick 2020). The former are able to efficiently concentrate the dust density around the binary. Therefore, the presence of such dust over-densities in CBDs should have important consequences for dust growth and eventually planetesimal formation. However, until now, most studies have focused on Class II stars with such asymmetries (Bae et al. 2023).
Moreover, images of discs around the younger (Class I, < 1 Myr) protostars HL Tau (ALMA Partnership 2015), GY 91 (Sheehan & Eisner 2018), and IRS 63 (Segura-Cox et al. 2020) have revealed conspicuous structures similar to those found in more evolved (Class II) T Tauri and Herbig AeBe stars (e.g. Andrews et al. 2018; Long et al. 2018). These discoveries have unambiguously brought along the idea that planets, which are possibly responsible for the observed gaps and rings, might actually form earlier than expected. A further indication is provided by the estimate mass of solids in Class II discs, which is insufficient to explain the observed exoplanet distribution (Manara et al. 2018; Tychoniec et al. 2020). To date, observations of substructures in young Class 0/I discs are limited because of the challenge of high dust opacity at millimetre-wavelengths (Ohashi et al. 2023). Even so, young protostars (often multiple) constitute unique laboratories for testing the early stages of planet formation.
For this study we focused on the circumbinary disc (CBD) around the Class I protostar L1551 IRS 5 (Adams et al. 1987; Looney et al. 1997). This system is located in Taurus (Strom et al. 1976) at a distance of 146.4 ± 0.5 pc (Galli et al. 2018, 2019) and has a luminosity of Lbol = 26.6 L⊙ (Green et al. 2013). L1551 IRS 5 is surrounded by a large rotating and infalling envelope, whose motion was measured through lines from several species (e.g. White et al. 2006). Its binary nature was first revealed by Bieging & Cohen (1985), where the northern and southern protostars have masses of 0.8 M⊙ and 0.3 M⊙, respectively (Looney et al. 1997; Liseau et al. 2005; Lim et al. 2016). In addition, Rodríguez et al. (2003) reported two parallel jets in this system. The binary is surrounded by a CBD whose size and mass are respectively ∼140 au and 0.02 − 0.03 M⊙ (Looney et al. 1997; Cruz-Sáenz de Miera et al. 2019). The CBD inclination and position angle are estimated using a 2D Gaussian fitting modelling and are i = 60° ± 2° and PA = 161° ± 2°, respectively (Cruz-Sáenz de Miera et al. 2019). Based on ALMA observations from the FAUST (Fifty AU STudy of the chemistry in the disc/envelope system of solar-like protostars1) Large Programme (Codella et al. 2021), Bianchi et al. (2020) reported the discovery of a hot corino around the northern (primary) star and possibly around the southern (secondary) star. More recently, additional ALMA observations indicate the presence of two compact dusty discs around each stellar component (Maureira et al. 2026). The orbit of the L1551 IRS 5 binary (with an orbital period of about 260 yr, first constrained by Lim et al. 2016) was also refined by combining nearly 40 years of VLA and ALMA astrometric measurements by Hernández Garnica et al. (2024) who obtained a binary semi-major axis of ∼44 au. The mass of the system is constrained to be 0.96 ± 0.17 M⊙, and the eccentricity is found to be slightly below 0.3. Previous studies have suggested that the binary–disc interaction is responsible for the asymmetrical disc morphology observed (Takakuwa et al. 2017; Matsumoto et al. 2019; Takakuwa et al. 2020).
In this article, we present new ALMA observations of L1551 IRS 5 in Sect. 2 and tailored hydrodynamical models of the ongoing binary–disc interaction along with synthetic observations in Sect. 3. We discuss the implications of our results for disc evolution and planet formation around young binary stars in Sect. 4.
2. FAUST observations of L1551 IRS 5
L1551-IRS5 was observed by ALMA, between October 2018 and January 2019, as part of the FAUST Large Program (project 2018.1.01205.L; PI: S. Yamamoto, Codella et al. 2021). The phase centre was at the coordinates αJ2000 = 04h 31m 34 14, δJ2000 = +18° 08′ 05
 10. The continuum data presented here were acquired using the most extended FAUST configuration (C43-5), with baselines ranging between 15 m and 1.4 km. The C18O (2-1) at 219.56036 GHz (Eup = 16 K) was observed in Band 6, in two 12 m array configurations: the most extended with baselines ranging between 15 m and 1.4 km (C43-5), and an intermediate with baselines between 15 m and 484 m (C43-2). Observations were complemented using the 7 m Atacama Compact Array (ACA), with baselines between 8.9 m and 48.9 m. For the most extended configuration and the ACA observations, the band-pass and flux calibrator is the quasar J0423-0120, while the phase calibrator is J0510+1800. For the intermediate configuration, the band-pass and flux calibrator is J0510+1800, while the phase calibrator is J0440+1437. The spectral window covering the C18O (2-1) transition has a spectral resolution of 122 kHz (∼0.17 km s−1). The data were calibrated using the ALMA calibration pipeline in CASA (CASA Team 2022), and an additional calibration routine to correct for the system temperature (Tsys) and spectral line data normalisation2. Finally, self-calibration was performed using line-free continuum channels. The uncertainty on the absolute flux calibration is about 10%.
The dust emission in L1551 IRS5 shows two compact sources and an extended (∼1″, corresponding to 146 au at the source distance) circumbinary disc (Bianchi et al. 2020; Cruz-Sáenz de Miera et al. 2019; Maureira et al. 2026). To highlight the emission from the circumbinary disc, the imaging was performed using super-uniform weighting to give extra weight to the longest baselines. CLEAN was then manually performed placing clean boxes around the two central sources in order to remove the emission of the two circumstellar discs, as detailed in Durán et al. (2025). The restored beam is 0 2 (∼30 au) and the rms is 0.5 mJy beam−1. The resulting image is shown in Fig. 1 (left panel). An over-density is observed in the northern part of the circumbinary disc. The maximum emission in the over-density, corresponding to the brightest area within the CBD, is at the coordinates αJ2000 = 04h31m34
 150, δJ2000 = +18°08′ 05
 154. Another weaker emission peak is observed in the southern part of the circumbinary disc at the position αJ2000 = 04h31m34
 177, δJ2000 = +18°08′03
 799. A flux ratio of 1.2 (0.2) is measured between the two emission peaks, which is consistent with the measured ratio of 1.4 at the same coordinates in the continuum image using the standard cleaning (Bianchi et al. 2020). The overall emission map shows that the dusty disc extends for more than 2″: the inner 2″ are dominated by the protostellar emission, while the external part is fainter by a factor of 5-6.
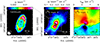 |
Fig. 1. Left: Continuum emission at 1.33 mm in colour scale (see Sect. 2). The contours indicate the protostellar discs, subtracted from the image during the cleaning process. The first contours and steps are 30σ (13 mJy beam−1) and 100σ, respectively. The black stars indicate the positions of the N and S protostars. Middle: Moment 0 map of the C18O emission (integrated between −10 km s−1 and +20 km s−1) in colour scale superposed to the 1.3 mm dust continuum emission in grey contours (from Bianchi et al. 2020). The first contours and steps are 10σ (1.8 mJy beam−1) and 100σ, respectively. Right: Moment 1 map of the C18O emission in colour scale, 1.3 mm dust continuum emission in grey contours. The moment 1 map is generated using a threshold of 5σ (20 mJy beam−1). The source systemic velocity (vsys) is 6.4 km s−1 (Mercimek et al. 2022). |
A recent multi-wavelength analysis of L1551 IRS 5 (Maureira et al. 2026) shows that the dust optical depth at 1.3 mm along the continuum enhancements is modest (τ1.3m ∼ 0.3–0.4), excluding optical-depth saturation as their cause; spectral-index values β ≲ 1 in the southern feature further suggest local grain growth. The C18O(2–1) emission, expected to be optically thin at ∼50 au, was imaged by combining the 12m and 7m data with a robust parameter of 0.5, yielding a  beam and 2.0 mJy beam−1 rms. In Fig. 1, the moment 0 (centre) and moment 1 (right) maps reveal gas that is more extended than the continuum, tracing both the CBD and the envelope. Moreover, the resolved arc-like continuum morphology and the S-shaped velocity field are not consistent with projection effects alone and are characteristic of binary–disc interactions (Rosenfeld et al. 2014; Price et al. 2018a).
3. Modelling of the CBD in L1551 IRS 5
3.1. Hydrodynamical simulations
We modelled the binary system in L1551 IRS 5 and its circumbinary disc using 3D hydrodynamical simulations with the smoothed particle hydrodynamics (SPH) code Phantom (Price et al. 2018b), using the one-fluid approach for gas and dust mixtures and without self-gravity. The binary is represented by two sink particles with masses M1 = 0.8 M⊙ and M2 = 0.3 M⊙, and its orbital parameters are sampled to be nearly coplanar with the disc and mildly eccentric (see Appendix A.1 for further details).
In the upper row of Fig. 2, we show the gas and dust surface density maps after 13 kyr of evolution, which corresponds to more than 50 binary orbital periods. Due to the binary interaction, the disc morphology rapidly evolves from the unperturbed state at the beginning of the simulation, but reaches a steady configuration after approximately ten binary orbital periods. From that time onwards, the disc morphology is characterised by the formation of a precessing over-density near the CBD inner edge, whose precession period is approximately equal to 1400 yr (roughly five times the binary orbital period). We note some variability in the binary orbital phase given that the binary is slightly eccentric and that the secondary star is closer to the CBD inner edge (compared to the primary). This leads to the formation of spiral-shaped streamers that periodically cross the orbit of the inner stars. Last, given the strong level of coupling between the gas and the dust particles (see the Stokes numbers in Appendix A.1 and the dust-to-gas plot in Fig. A.2), we note that the two surface density maps exhibit the same morphology. Hence, the horseshoe-shaped azimuthal over-density in the gas translates into a dust over-density at exactly the same location. Given that the disc over-density is rotating in a Keplerian fashion and that the stars move on shorter timescales, the proposed configuration is not unique, but is consistent and in excellent agreement with the current disc morphology and stars’ positions. The impact of the expected CBD dynamics in L1551 IRS 5 on dust growth and stellar stellar accretion is discussed in Sect. 4.
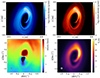 |
Fig. 2. Top row: PHANTOM hydrodynamical models of L1551 IRS 5, gas surface density (left) and 100 μm dust particles surface density (right). Bottom row: MCFOST synthetic observations, C18O moment 1 map (left) and continuum emission (right). Snapshots after 13 100 years, which correspond to more than 50 binary orbits. All the images are shown using the same scale (top in au and bottom in arcsec). |
3.2. Radiative transfer models
To compare our model with observations of L1551 IRS 5, we post-processed a subset of our simulations using the Monte Carlo radiative transfer code MCFOST (Pinte et al. 2006, 2009). This allowed us to map the hydrodynamical simulation outputs onto a radiative transfer grid without interpolation, compute thermal dust emission, and predict line emission from gas assuming local thermodynamic equilibrium (see Appendix A.2 for details).
In the lower row of Fig. 2, we show the C18O moment 1 map (left) and the continuum emission map (right) obtained with MCFOST using the methodology described above. The former is in good agreement with the rightmost panel of Fig. 1, with comparable deviations from the systemic velocity and with the same twisted pattern in the innermost region (in green). This peculiar feature is the result of the infalling material, which adds a radial velocity component within the cavity, smeared out by the beam size as described in Rosenfeld et al. (2014). Similar patterns are routinely observed in Class II discs in which the inner disc regions are twisted and/or misaligned with respect to the outer regions. Remarkably, (sub)stellar companions within the inner disc cavity can create such structures, as described in Ragusa et al. (2021). Last, the synthetic continuum map emission is in good agreement with the leftmost panel of Fig. 1 given that we recover the prominent azimuthal over-density in the NE side of the disc. We note, however, that our model does not reproduce satisfactorily the over-density located on the opposite disc side, which could potentially be connected with the spiral pattern created by the inner binary in the SW disc side.
4. Discussion and conclusions
The comparison between our model and the FAUST observations of L1551 IRS5 provide evidence that the most prominent CBD features (disc size, morphology, kinematics) can be well explained by the periodic perturbation of the inner binary. In particular, the continuum over-density spatially coincides with the binary-induced gas over-density in the inner CBD edge. This supports an ongoing binary-disc interaction in which the over-density indicates that the dust concentration is locally enhanced with respect to the rest of the CBD. However, as shown in Fig. A.2, the dust-to-gas ratio remains uniform, as opposed to a dust trap where the dust-to-gas ratio increases. It is worth noting that Maureira et al. (2026) recently reported a spectral index map for L1551 IRS 5 consistent with a mild level of grain growth within the disc. This physical mechanism is not considered in our modelling though. Considering that the disc is optically thin (Takakuwa et al. 2020; Maureira et al. 2026), future multi-wavelength observations will allow us to further quantify grain growth within the CBD. At any rate, our qualitative model suggests that the dust over-density is expected to be long-lived (as in Ragusa et al. 2020) and that the physical conditions to efficiently concentrate dust could already be obtained during the Class 0/I phase (Cridland et al. 2022). This could potentially lead to a disc morphology similar to IRS 48, a Class II source in which there is strong evidence of azimuthal dust trapping in the disc (van der Marel et al. 2013; Calcino et al. 2019).
The method we followed in this work combines disc observations, astrometry, and hydrodynamical modelling of L1551 IRS5 in order to better constrain the inner binary orbit (mainly in terms of a, e, and i). In particular, among the possible orbits allowed by the astrometry in Hernández Garnica et al. (2024), we selected the most consistent orbit considering the specific disc morphology obtained from observations. Although our model is designed for a specific source, this approach outlines the importance of considering constraints of a different nature when modelling young multiple sources with partial time-coverage (see e.g. Duchêne et al. 2024; Toci et al. 2024).
In the circumbinary disc of L1551 IRS 5, we observe a distinct cavity and an azimuthal over-density at the inner edge. Accretion streamers feed material onto the binary, likely modulating stellar brightness and episodic accretion events (Connelley & Greene 2014). Unlike the models of Takakuwa et al. (2020), in which the cavity is only partially carved and the northern flux excess is attributed to a tightly wound southern spiral, we find that the over-density arises from direct binary–disc interaction and is not part of a large-scale spiral. In our simulations, the southern infalling spiral is more prominent than the northern one, reflecting the asymmetry observed in the system and highlighting alternative pathways for material transfer. By incorporating updated astrometric constraints, our model provides a coherent explanation for the observed disc substructures and dynamics, with fewer discrepancies compared to previous models.
In addition, the interaction between the CBD and the binary naturally channels material onto each protostar, and this enhanced accretion may be connected to the observed outflows and to the jets first identified by Itoh et al. (2000). Discrepancies between our hydrodynamical simulations and ALMA observations (mainly regarding the extent of gas emission), can be attributed to our simulations not incorporating the surrounding envelope, which is beyond the scope of this work. This omission results in the simulations underestimating the spatial extent of the C18O emission, which in actual observations is influenced by contributions from both the disc and the envelope. Such insights emphasise the necessity to integrate envelope dynamics in future models to enhance the fidelity of simulated astrophysical phenomena against real observational data, especially in young embedded systems such as L1551 IRS 5.
Thanks to upcoming morphological, chemical, and kinematical surveys that will enhance our understanding of Class 0/I protostars with unparalleled spectral and spatial detail, the field of protostellar formation is on the verge of major breakthroughs. Initiatives such as those undertaken by the FAUST collaboration (Codella et al. 2021) exemplify this ongoing effort within the community. Recent studies, including the detailed characterisation of the remarkable Class I quadruple stellar system VLA 1623-2417 (Ohashi et al. 2022; Mercimek et al. 2023; Codella et al. 2024; Radley et al. 2025), highlight the intricate dynamics and early evolutionary stages of these young systems. Insights obtained from such investigations are vital for unravelling the complex processes governing the formation and early development of protostellar discs. This in turn will be crucial for elucidating how dust accumulates within these discs and the subsequent emergence of embedded planets, offering a clearer picture of planetary formation around young stars.
Acknowledgments
We thank Antoine Alaguero, Daniel J. Price, and Christophe Pinte for scientific discussions and technical support. This research has made use of the NASA Astrophysics Data System. This project has received funding from the European Research Council (ERC) under the European Union Horizon Europe programme (grant agreements No. 101042275, project Stellar-MADE; No. 101053020, project Dust2Planets). NC acknowledges support from the European Union’s Horizon 2020 research and innovation programme under the Marie Skłodowska-Curie grant agreement No 896319. L.L. acknowledges the support of DGAPA PAPIIT grants IN108324 and IN112820 and CONACyT-CF grant 263356. EB acknowledges support from the Deutsche Forschungsgemeinschaft (DFG, German Research Foundation) under Germanys Excellence Strategy – EXC 2094 – 390783311. LP, ClCo, EB, GS acknowledge the PRIN-MUR 2020 BEYOND-2p (“Astrochemistry beyond the second period elements”, Prot. 2020AFB3FX), the project ASI-Astrobiologia 2023 MIGLIORA (Modeling Chemical Complexity, F83C23000800005), the INAF-GO 2023 fundings PROTO-SKA (Exploiting ALMA data to study planet forming discs: preparing the advent of SKA, C13C23000770005), the INAF Mini-Grant 2022 “Chemical Origins” (PI: L. Podio), INAF-Minigrant 2023 TRIESTE (“TRacing the chemIcal hEritage of our originS: from proTostars to planEts”; PI: G. Sabatini), the National Recovery and Resilience Plan (NRRP), Mission 4, Component 2, Investment 1.1, Call for tender No. 104 published on 2.2.2022 by the Italian Ministry of University and Research (MUR), funded by the European Union – NextGenerationEU– Project Title 2022JC2Y93 ChemicalOrigins: linking the fossil composition of the Solar System with the chemistry of protoplanetary discs – CUP J53D23001600006 – Grant Assignment Decree No. 962 adopted on 30.06.2023 by the Italian Ministry of Ministry of University and Research (MUR). I.J-.S acknowledges funding from grant PID2022-136814NB-I00 funded by the Spanish Ministry of Science, Innovation and Universities/State Agency of Research MICIU/AEI/ 10.13039/501100011033 and by “ERDF/EU”. This Letter makes use of the following ALMA data: ADS/JAO.ALMA#2018.1.01205.L (PI: S. Yamamoto). ALMA is a partnership of the ESO (representing its member states), the NSF (USA) and NINS (Japan), together with the NRC (Canada) and the NSC and ASIAA (Taiwan), in cooperation with the Republic of Chile. The Joint ALMA Observatory is operated by the ESO, the AUI/NRAO, and the NAOJ.
References
- Adams, F. C., Lada, C. J., & Shu, F. H. 1987, ApJ, 312, 788 [NASA ADS] [CrossRef] [Google Scholar]
- ALMA Partnership, Brogan, C. L., Pérez, L. M., et al. 2015, ApJ, 808, L3 [NASA ADS] [CrossRef] [Google Scholar]
- Andrews, S. M., Huang, J., Pérez, L. M., et al. 2018, ApJ, 869, L41 [NASA ADS] [CrossRef] [Google Scholar]
- Bae, J., Isella, A., Zhu, Z., et al. 2023, in Protostars and Planets VII, eds. S. Inutsuka, Y. Aikawa, T. Muto, K. Tomida, & M. Tamura, ASP Conf. Ser., 534, 423 [NASA ADS] [Google Scholar]
- Bate, M. R. 2018, MNRAS, 475, 5618 [Google Scholar]
- Bate, M. R., Bonnell, I. A., & Price, N. M. 1995, MNRAS, 277, 362 [Google Scholar]
- Bianchi, E., Chandler, C. J., Ceccarelli, C., et al. 2020, MNRAS, 498, L87 [NASA ADS] [CrossRef] [Google Scholar]
- Bieging, J. H., & Cohen, M. 1985, ApJ, 289, L5 [Google Scholar]
- Calcino, J., Price, D. J., Pinte, C., et al. 2019, MNRAS, 490, 2579 [Google Scholar]
- CASA Team (Bean, B., et al.) 2022, PASP, 134, 114501 [NASA ADS] [CrossRef] [Google Scholar]
- Casassus, S., Wright, C. M., Marino, S., et al. 2015, ApJ, 812, 126 [NASA ADS] [CrossRef] [Google Scholar]
- Codella, C., Ceccarelli, C., Chandler, C., et al. 2021, Fron. Astron. Space Sci., 8, 227 [Google Scholar]
- Codella, C., Podio, L., De Simone, M., et al. 2024, MNRAS, 528, 7383 [NASA ADS] [CrossRef] [Google Scholar]
- Connelley, M. S., & Greene, T. P. 2014, AJ, 147, 125 [Google Scholar]
- Cridland, A. J., Rosotti, G. P., Tabone, B., et al. 2022, A&A, 662, A90 [NASA ADS] [CrossRef] [EDP Sciences] [Google Scholar]
- Cruz-Sáenz de Miera, F., Kóspál, Á., Ábrahám, P., Liu, H. B., & Takami, M. 2019, ApJ, 882, L4 [CrossRef] [Google Scholar]
- Draine, B. T. 2003, ApJ, 598, 1017 [NASA ADS] [CrossRef] [Google Scholar]
- Duchêne, G., & Kraus, A. 2013, ARA&A, 51, 269 [Google Scholar]
- Duchêne, G., LeBouquin, J.-B., Ménard, F., et al. 2024, A&A, 686, A188 [NASA ADS] [CrossRef] [EDP Sciences] [Google Scholar]
- Durán, A., Loinard, L., Rivera-Ortiz, P. R., et al. 2025, MNRAS, 541, 337 [Google Scholar]
- Galli, P. A. B., Loinard, L., Ortiz-Léon, G. N., et al. 2018, ApJ, 859, 33 [Google Scholar]
- Galli, P. A. B., Loinard, L., Bouy, H., et al. 2019, A&A, 630, A137 [NASA ADS] [CrossRef] [EDP Sciences] [Google Scholar]
- Green, J. D., Evans, N. J. I., Jørgensen, J. K., et al. 2013, ApJ, 770, 123 [NASA ADS] [CrossRef] [Google Scholar]
- Hernández Garnica, R., Loinard, L., Duran, A., et al. 2024, MNRAS, 535, 2948 [Google Scholar]
- Hirsh, K., Price, D. J., Gonzalez, J.-F., Ubeira-Gabellini, M. G., & Ragusa, E. 2020, MNRAS, 498, 2936 [NASA ADS] [CrossRef] [Google Scholar]
- Itoh, Y., Kaifu, N., Hayashi, M., et al. 2000, PASJ, 52, 81 [Google Scholar]
- Kuruwita, R. L., & Haugbølle, T. 2023, A&A, 674, A196 [NASA ADS] [CrossRef] [EDP Sciences] [Google Scholar]
- Laibe, G., & Price, D. J. 2014, MNRAS, 440, 2136 [Google Scholar]
- Lebreuilly, U., Hennebelle, P., Colman, T., et al. 2021, ApJ, 917, L10 [NASA ADS] [CrossRef] [Google Scholar]
- Lim, J., Yeung, P. K. H., Hanawa, T., et al. 2016, ApJ, 826, 153 [NASA ADS] [CrossRef] [Google Scholar]
- Liseau, R., Fridlund, C. V. M., & Larsson, B. 2005, ApJ, 619, 959 [NASA ADS] [CrossRef] [Google Scholar]
- Lodato, G., & Price, D. J. 2010, MNRAS, 405, 1212 [NASA ADS] [Google Scholar]
- Long, F., Pinilla, P., Herczeg, G. J., et al. 2018, ApJ, 869, 17 [Google Scholar]
- Looney, L. W., Mundy, L. G., & Welch, W. J. 1997, ApJ, 484, L157 [NASA ADS] [CrossRef] [Google Scholar]
- Manara, C. F., Morbidelli, A., & Guillot, T. 2018, A&A, 618, L3 [NASA ADS] [CrossRef] [EDP Sciences] [Google Scholar]
- Matsumoto, T., Saigo, K., & Takakuwa, S. 2019, ApJ, 871, 36 [CrossRef] [Google Scholar]
- Maureira, M. J., Pineda, J. E., Liu, H. B., et al. 2026, A&A, 705, A96 [NASA ADS] [CrossRef] [EDP Sciences] [Google Scholar]
- Mercimek, S., Codella, C., Podio, L., et al. 2022, A&A, 659, A67 [NASA ADS] [CrossRef] [EDP Sciences] [Google Scholar]
- Mercimek, S., Podio, L., Codella, C., et al. 2023, MNRAS, 522, 2384 [NASA ADS] [CrossRef] [Google Scholar]
- Muñoz, D. J., & Lithwick, Y. 2020, ApJ, 905, 106 [CrossRef] [Google Scholar]
- Offner, S. S. R., Moe, M., Kratter, K. M., et al. 2023, in Protostars and Planets VII, eds. S. Inutsuka, Y. Aikawa, T. Muto, K. Tomida, & M. Tamura, ASP Conf. Ser., 534, 275 [NASA ADS] [Google Scholar]
- Ohashi, S., Codella, C., Sakai, N., et al. 2022, ApJ, 927, 54 [NASA ADS] [CrossRef] [Google Scholar]
- Ohashi, N., Tobin, J. J., Jørgensen, J. K., et al. 2023, ApJ, 951, 8 [NASA ADS] [CrossRef] [Google Scholar]
- Pearce, T. D., Wyatt, M. C., & Kennedy, G. M. 2015, MNRAS, 448, 3679 [NASA ADS] [CrossRef] [Google Scholar]
- Pinte, C., Ménard, F., Duchêne, G., & Bastien, P. 2006, A&A, 459, 797 [NASA ADS] [CrossRef] [EDP Sciences] [Google Scholar]
- Pinte, C., Harries, T. J., Min, M., et al. 2009, A&A, 498, 967 [NASA ADS] [CrossRef] [EDP Sciences] [Google Scholar]
- Poblete, P. P., Cuello, N., & Cuadra, J. 2019, MNRAS, 489, 2204 [NASA ADS] [CrossRef] [Google Scholar]
- Price, D. J., & Laibe, G. 2015, MNRAS, 451, 813 [NASA ADS] [CrossRef] [Google Scholar]
- Price, D. J., Cuello, N., Pinte, C., et al. 2018a, MNRAS, 477, 1270 [Google Scholar]
- Price, D. J., Wurster, J., Tricco, T. S., et al. 2018b, PASA, 35 [Google Scholar]
- Radley, I. C., Busquet, G., Ilee, J. D., et al. 2025, ApJ, 981, 187 [Google Scholar]
- Ragusa, E., Dipierro, G., Lodato, G., Laibe, G., & Price, D. J. 2017, MNRAS, 464, 1449 [Google Scholar]
- Ragusa, E., Alexander, R., Calcino, J., Hirsh, K., & Price, D. J. 2020, MNRAS, 499, 3362 [NASA ADS] [CrossRef] [Google Scholar]
- Ragusa, E., Fasano, D., Toci, C., et al. 2021, MNRAS, 507, 1157 [NASA ADS] [CrossRef] [Google Scholar]
- Reipurth, B., Clarke, C. J., Boss, A. P., et al. 2014, in Protostars and Planets VI, eds. H. Beuther, R. S. Klessen, C. P. Dullemond, & T. Henning, 267 [Google Scholar]
- Rodríguez, L. F., Porras, A., Claussen, M. J., et al. 2003, ApJ, 586, L137 [CrossRef] [Google Scholar]
- Rosenfeld, K. A., Chiang, E., & Andrews, S. M. 2014, ApJ, 782, 62 [Google Scholar]
- Segura-Cox, D. M., Schmiedeke, A., Pineda, J. E., et al. 2020, Nature, 586, 228 [NASA ADS] [CrossRef] [Google Scholar]
- Sheehan, P. D., & Eisner, J. A. 2018, ApJ, 857, 18 [NASA ADS] [CrossRef] [Google Scholar]
- Strom, K. M., Strom, S. E., & Vrba, F. J. 1976, AJ, 81, 320 [Google Scholar]
- Takakuwa, S., Saigo, K., Matsumoto, T., et al. 2017, ApJ, 837, 86 [NASA ADS] [CrossRef] [Google Scholar]
- Takakuwa, S., Saigo, K., Matsumoto, T., et al. 2020, ApJ, 898, 10 [NASA ADS] [CrossRef] [Google Scholar]
- Thun, D., Kley, W., & Picogna, G. 2017, A&A, 604, A102 [NASA ADS] [CrossRef] [EDP Sciences] [Google Scholar]
- Tobin, J. J., Looney, L. W., Li, Z.-Y., et al. 2016, ApJ, 818, 73 [CrossRef] [Google Scholar]
- Tobin, J. J., Offner, S. S. R., Kratter, K. M., et al. 2022, ApJ, 925, 39 [NASA ADS] [CrossRef] [Google Scholar]
- Toci, C., Ceppi, S., Cuello, N., et al. 2024, A&A, 688, A102 [NASA ADS] [CrossRef] [EDP Sciences] [Google Scholar]
- Tychoniec, Ł., Manara, C. F., Rosotti, G. P., et al. 2020, A&A, 640, A19 [NASA ADS] [CrossRef] [EDP Sciences] [Google Scholar]
- van der Marel, N., van Dishoeck, E. F., Bruderer, S., et al. 2013, Science, 340, 1199 [Google Scholar]
- Villenave, M., Ménard, F., Dent, W. R. F., et al. 2020, A&A, 642, A164 [EDP Sciences] [Google Scholar]
- Villenave, M., Podio, L., Duchêne, G., et al. 2023, ApJ, 946, 70 [NASA ADS] [CrossRef] [Google Scholar]
- White, G. J., Fridlund, C. W. M., Bergman, P., et al. 2006, ApJ, 651, L41 [NASA ADS] [CrossRef] [Google Scholar]
Appendix A: Supplementary material
A.1. Hydrodynamical modelling
We modelled the binary in L1551 IRS 5 and its circumbinary disc through 3D hydrodynamical simulations performed with the smoothed particle hydrodynamics (SPH) code PHANTOM (Price et al. 2018b). We used SPH artificial viscosity to model angular momentum transport within the CBD, adopting αAV = 0.25 and βAV = 2.0. This set-up corresponds to an effective αSS ≃ 3 − 5 × 10⁻³ (Lodato & Price 2010). The binary is modelled using two sink particles of mass M1 = 0.8 M⊙ and M2 = 0.3 M⊙ (see observational constraints in Sect. 1), which corresponds to a mass ratio q = M2/M1 = 0.375 and a binary total mass Mb = 1.1 M⊙. We removed SPH particles from the simulation whenever they cross the sink radius (Rsink = 5 au) of one of the sink particles, as in Bate et al. (1995). Sink particles exert gravity on each other and are free to interact with the material from the circumbinary disc.
In order to define the binary orbit, we ran a Monte Carlo calculations using IMORBEL3 (Pearce et al. 2015) to sample the parameter space of possible orbits. To better guide this parameter space exploration, we imposed the binary orbit to be close to coplanar with respect to the CBD and only mildly eccentric (below 0.2; in agreement with Hernández Garnica et al. 2024). The latter choice was further motivated by the fact that, for unequal mass binaries, the overall disc morphology and the observed dust over-density in particular are well reproduced for mildly eccentric and nearly coplanar binaries with respect to the CBD (Poblete et al. 2019). Following this approach, we obtained the following possible binary orbital parameters: semi-major axis ab = 42.2 au, eccentricity eb = 0.175, inclination ib = 122.3deg, PA of ascending node Ω = 168.9deg, argument of periastron ω = 176.5deg, and initial true anomaly f = 163.5deg.
We use the one-fluid method described in Laibe & Price (2014) and Price & Laibe (2015) to model a mixture of gas and dust using 106 SPH particles, a sufficient resolution to vertically resolve the disc. We set the grain size s = 0.1 mm with intrinsic density ρd = 3 g cm−3 (typical of silicates). The dust size is considered to be constant and was selected to correspond to grains emitting at 1.3 mm since we are mainly interested in Band 6 ALMA observations. These particles are distributed between Rin = 60 au and Rout = 140 au, following an initial surface density profile defined as: Σ = Σ0(R/R0)−1, with R0 = 100 au and Σ0 = 8.84 g cm−2. For completeness, we run an additional simulation where we set the dusty disc at Rin = 80 au (instead of 60 au) and find no significant differences compared to the nominal case (see Fig. A.3). Therefore, the initial condition does not strongly impact the emergence of the over-density. For the specific case of L1551 IRS 5, the surrounding material is divided into two components: the CBD and the infalling envelope, each with a different power-law index. Here we are mainly interested in the disc so we chose to neglect the envelope. The CBD aspect ratio if fixed to 0.05 at a distance of 100 au from the binary centre of mass, consistent with recent measurements for Class I discs (Villenave et al. 2023). Once the simulations starts, the CBD feels the periodic gravitational perturbation of the inner binary (creating spirals, streamers, and the dust enhancement) and the disc also expands radially due to viscous forces (Price et al. 2018b,a).
We assume that initially the dust component is uniformly distributed within the gaseous disc and we adopt a typical value of 0.01 for the dust-to-gas ratio. A simple estimate of the dimensionless Stokes number at the inner edge (60 au) is

using Σ(60 au)≃14.7 g cm−2, s = 0.1 mm, and ρs = 3 g cm−3 yields St ≈ 3 × 10⁻³. Thus, the 0.1 mm particles in our runs are tightly coupled to the gas, fully validating the one-fluid algorithm adopted for the simulations. This strong coupling is also consistent with the behaviour seen in Fig. 1, where dust and gas follow nearly identical large-scale structures. We also note that considering icy aggregates with ρs = 1 g cm−3 would not affect the coupling in a significant way (only by a factor of 3).
In addition, we estimate the Toomre parameter as
using cs = hvk and vk2 = GM★/R. With M★ = 1.1 M⊙, h = 0.05, and our surface-density profile (Σ(60 au)≃14.7 g cm−2, Σ(100 au) = 8.84 g cm−2) we obtain Q ≈ 3.0 at 60 au, Q ≈ 1.8 at 100 au and Q ≈ 1.3 at 140 au. These values (all > 1) indicate that the circumbinary disc is globally stable against axisymmetric gravitational collapse under our assumed parameters. We note, however, that uncertainties in Σ, h and any additional mass in the envelope could lower Q locally; nevertheless, with the disc masses inferred for L1551 IRS 5 (∼0.02–0.03 M⊙) self-gravity is unlikely to dominate the dynamics in the region modelled. The snapshot with the highest level of resemblance to the observations (across different wavelength and tracers) is shown in the upper row of Figure 2.
A.2. Radiative transfer calculations
In order to perform a direct comparison of the proposed model with the available observations of L1551 IRS 5, we post-processed a set of outputs from the hydrodynamical simulations using the public Monte Carlo radiative transfer code MCFOST (version 4.1, Pinte et al. 2006, 2009). The Voronoi tessellation used in MCFOST is particularly well-suited to post-process data from PHANTOM since each cell corresponds to the position of an SPH particle. Therefore, we map the density, temperature, velocity maps from the hydrodynamical simulations into the radiative transfer grid without any interpolation.
The disc is irradiated using 1.28 × 10⁸ photons packets, considering two sink particles of different luminosity as isotropic sources with stellar spectral models appropriate to their mass. In our calculations, we set the temperatures of the stars so the primary (N) and secondary (S) components have luminosities equal to 26.4 L⊙ and 0.2 L⊙ (respectively). The combined luminosity is in agreement with the available observations constraints (Green et al. 2013). We assume astronomical silicates (Draine 2003), with a grain size distribution ranging from 0.03 μm to 1 mm, and a slope of −3.5. Optical properties are calculated using Mie theory. The whole system (stellar binary and CBD) is observed from a distance of 141 pc and inclined using the same angles as in Bianchi et al. (2020).
Finally, we predict line emission from the gas content of the disc for the isotopologues of carbon monoxide C18O. Furthermore, we suppose that the gas is in local thermodynamic equilibrium with Tgas = Tdust. Last, we compute the thermal emission from dust in the continuum based on the dust distribution in the disc. With these emission maps and data cubes, we then produce the synthetic images presented in the bottom row of Figure 2.
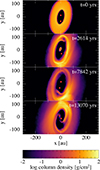 |
Fig. A.1. Gas surface density for different evolutionary stages for our nominal PHANTOM hydrodynamical model. Time moves forward from top to bottom: 0, 10, 30, 50 binary orbits. |
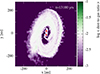 |
Fig. A.2. Dust-to-gas ratio after t = 13 100 years. The homogeneous distribution indicates that the dust over-density corresponds to a dust concentration rather than a dust trap for which the ratio should increase at the over-density location. |
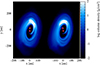 |
Fig. A.3. Comparison between two different initial conditions with Rin = 60 au (left panel) and Rin = 80 au (right panel) after t = 13 100 years. We do not see noticeable differences showing that the over-density is not a direct result of the initial condition. |
All Figures
|
Fig. 1. Left: Continuum emission at 1.33 mm in colour scale (see Sect. 2). The contours indicate the protostellar discs, subtracted from the image during the cleaning process. The first contours and steps are 30σ (13 mJy beam−1) and 100σ, respectively. The black stars indicate the positions of the N and S protostars. Middle: Moment 0 map of the C18O emission (integrated between −10 km s−1 and +20 km s−1) in colour scale superposed to the 1.3 mm dust continuum emission in grey contours (from Bianchi et al. 2020). The first contours and steps are 10σ (1.8 mJy beam−1) and 100σ, respectively. Right: Moment 1 map of the C18O emission in colour scale, 1.3 mm dust continuum emission in grey contours. The moment 1 map is generated using a threshold of 5σ (20 mJy beam−1). The source systemic velocity (vsys) is 6.4 km s−1 (Mercimek et al. 2022). |
| In the text | |
|
Fig. 2. Top row: PHANTOM hydrodynamical models of L1551 IRS 5, gas surface density (left) and 100 μm dust particles surface density (right). Bottom row: MCFOST synthetic observations, C18O moment 1 map (left) and continuum emission (right). Snapshots after 13 100 years, which correspond to more than 50 binary orbits. All the images are shown using the same scale (top in au and bottom in arcsec). |
| In the text | |
|
Fig. A.1. Gas surface density for different evolutionary stages for our nominal PHANTOM hydrodynamical model. Time moves forward from top to bottom: 0, 10, 30, 50 binary orbits. |
| In the text | |
|
Fig. A.2. Dust-to-gas ratio after t = 13 100 years. The homogeneous distribution indicates that the dust over-density corresponds to a dust concentration rather than a dust trap for which the ratio should increase at the over-density location. |
| In the text | |
|
Fig. A.3. Comparison between two different initial conditions with Rin = 60 au (left panel) and Rin = 80 au (right panel) after t = 13 100 years. We do not see noticeable differences showing that the over-density is not a direct result of the initial condition. |
| In the text | |
Current usage metrics show cumulative count of Article Views (full-text article views including HTML views, PDF and ePub downloads, according to the available data) and Abstracts Views on Vision4Press platform.
Data correspond to usage on the plateform after 2015. The current usage metrics is available 48-96 hours after online publication and is updated daily on week days.
Initial download of the metrics may take a while.