Open Access
Fig. 8.
Download original image
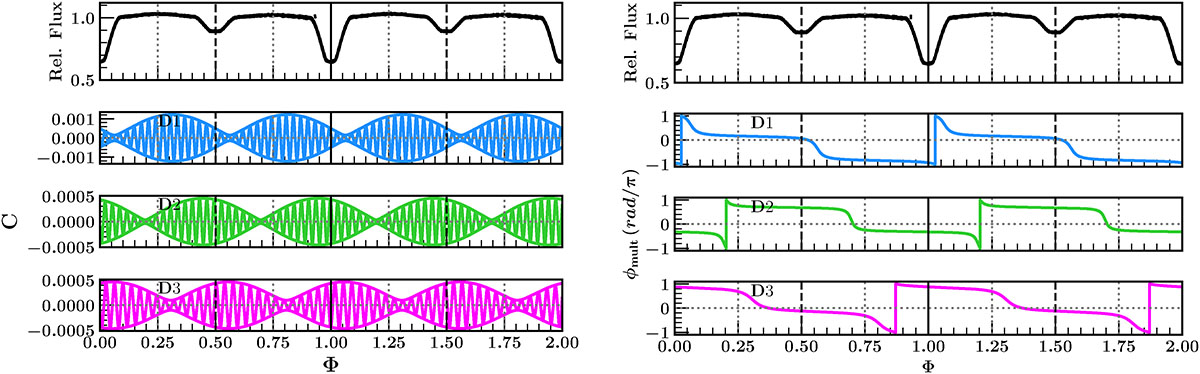
Pulsation runs of the different doublets identified in the Échelle diagram of TIC 126945917. The left panel shows the amplitude variations and the right panel shows the phase variations over the orbital phase. The vertical solid line shows phases of primary eclipse and the dashed vertical lines show the secondary eclipse.
Current usage metrics show cumulative count of Article Views (full-text article views including HTML views, PDF and ePub downloads, according to the available data) and Abstracts Views on Vision4Press platform.
Data correspond to usage on the plateform after 2015. The current usage metrics is available 48-96 hours after online publication and is updated daily on week days.
Initial download of the metrics may take a while.