Fig. A.3.
Download original image
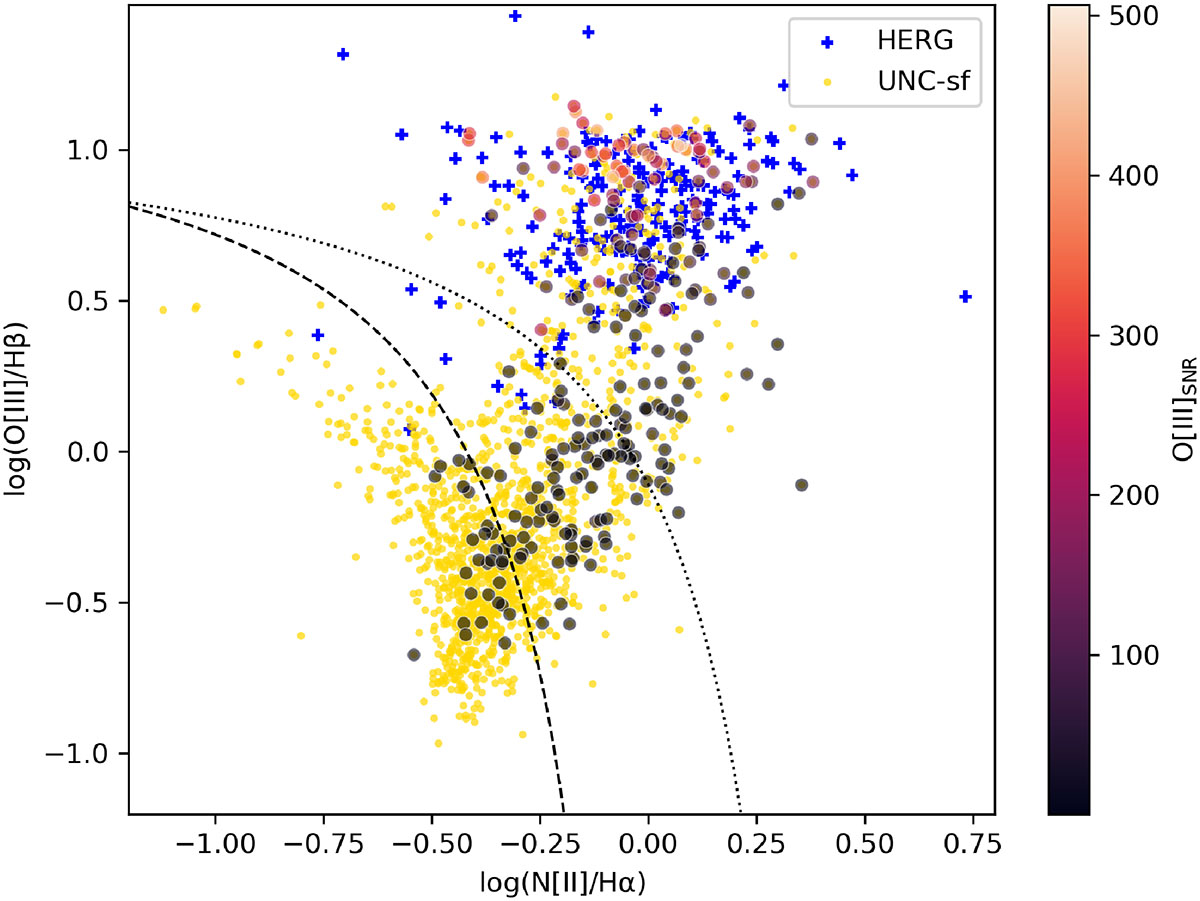
BPT diagram of HERG objects (blue crosses) and of UNCs selected as SF (UNC-sf, yellow). Circles coloured by O[III] SNR correspond to the subsample of UNC-sf that lie above the D4000 divide line in Figure A.1. For reference, we show the Kewley et al. (2001) maximum starburst line (dotted) and the Kauffmann et al. (2003) classification line (dashed).
Current usage metrics show cumulative count of Article Views (full-text article views including HTML views, PDF and ePub downloads, according to the available data) and Abstracts Views on Vision4Press platform.
Data correspond to usage on the plateform after 2015. The current usage metrics is available 48-96 hours after online publication and is updated daily on week days.
Initial download of the metrics may take a while.