| Issue |
A&A
Volume 705, January 2026
|
|
|---|---|---|
| Article Number | A192 | |
| Number of page(s) | 14 | |
| Section | Cosmology (including clusters of galaxies) | |
| DOI | https://doi.org/10.1051/0004-6361/202554346 | |
| Published online | 20 January 2026 | |
Environments of high and low excitation radio galaxies
1
Instituto de Ciencias Astronómicas, de la Tierra y del Espacio (ICATE) Av. Nazario Benavidez 8175 Oeste Chimbas San Juan, Argentina
2
Universidad Nacional de San Juan San Juan, Argentina
3
Consejo Nacional de Investigaciones Científicas y Técnicas (CONICET) Buenos Aires, Argentina
4
Facultad de Ciencias Exactas, Físicas y Naturales (FCEFYN-UNSJ), Universidad Nacional de San Juan Av. José Ignacio de la Roza Oeste 590 San Juan, Argentina
★ Corresponding author: This email address is being protected from spambots. You need JavaScript enabled to view it.
Received:
3
March
2025
Accepted:
24
October
2025
Abstract
Aims. Active galactic nuclei (AGNs) play a crucial role in shaping galaxy evolution through their feedback mechanisms. Low-excitation radio galaxies (LERGs) and high-excitation radio galaxies (HERGs) are thought to exhibit distinct feedback modes, and might potentially influence their surrounding environment in different ways.
Methods. This study aims to investigate the clustering properties and environmental differences of LERG and HERG. We analyse properties of galaxies in the vicinity of both AGN types to identify environmental trends.
Results. We utilized extensive datasets from the Sloan Digital Sky Survey (SDSS), the NRAO VLA Sky Survey (NVSS), and Faint Images of the Radio Sky at Twenty-Centimeters (FIRST). Clustering analyses were performed using the projected cross-correlation function between AGNs and inactive galaxies and then compared against matched control samples. The galaxy populations around each AGN class are statistically compared on the basis of their stellar mass, colour, and luminosity.
Conclusions. The LERGs and HERGs inhabit distinctly different environments. The LERGs are preferentially found in denser regions and are surrounded by redder, more massive, and brighter galaxies compared to the HERGs, even after matching host properties and radio power. Except at low masses, LERGs are commonly found residing in more clustered environments than inactive galaxies with matched physical properties of their hosts, while the opposite effect is observed in HERGs. We also identify trends in the colours of neighbouring galaxies, suggesting environmental influences beyond the host galaxy. These results highlight the strong interplay between the environment and radio AGN activity and support previous findings that link these effects to different fuelling mechanisms and gas supply.
Key words: galaxies: active / galaxies: groups: general / galaxies: statistics
© The Authors 2026
 Open Access article, published by EDP Sciences, under the terms of the Creative Commons Attribution License (https://creativecommons.org/licenses/by/4.0), which permits unrestricted use, distribution, and reproduction in any medium, provided the original work is properly cited.
This article is published in open access under the Subscribe to Open model. This email address is being protected from spambots. You need JavaScript enabled to view it. to support open access publication.
1. Introduction
The spatial distribution of active galactic nuclei (AGNs) and their relationship with the large-scale structure of the Universe are crucial aspects of galaxy evolution. Understanding how different types of AGNs, particularly radio-loud AGNs, cluster within the cosmic web can provide key insights into their formation, growth, duty cycle, and feedback mechanisms. During short, episodic lifetimes of ∼108 − 109 yr, these systems that host an active supermassive black hole produce large amounts of energy in the form of radio/x-ray emitting jets, injecting energy that can balance the radiative loses of the gas and impacting their surroundings by displacing and heating the gaseous intracluster medium up to large scales (McNamara et al. 2005; McNamara & Nulsen 2007). Semi-analytical models and hydrodynamical simulations have shown the key relevance of AGN feedback, in either a quasar or radio mode form, in augmenting other modes (e.g. supernova feedback) to reproduce observables such as the mass galaxy function (Bower et al. 2006; Croton et al. 2006), X-ray scaling relations (Puchwein et al. 2008), or cluster morphology (Chon et al. 2016).
To form a radiatively efficient accretion disc, an AGN has to accrete cold gas with high efficiency. Such a disc generates a strong UV radiation field that ionizes the medium and induces high-excitation emission lines in the optical spectrum of a radio galaxy, giving rise to two subpopulations known as high-excitation radio galaxies (HERGs) or low-excitation radio galaxies (LERGs) according to the presence or absence of those spectral features. Although radio-loud AGN activity is typically classified into HERGs and LERGs based on their emission-line properties (Buttiglione et al. 2010; Best & Heckman 2012), IR emission properties that track the signature of the power-law continuum of a dusty AGN torus (Lacy et al. 2004; Donley et al. 2012), or X-ray emission properties linked to radiatively efficient nuclear activity (Evans et al. 2006; Hardcastle et al. 2006), are also useful signatures of radiative efficiency in AGNs.
The LERG and HERG classification is thought to reflect a key physical difference between the two populations: the accretion mode. The LERGs are believed to be powered by radiatively inefficient (i.e. advection-dominated) accretion flows or ADAFs, producing extended radio jets that primarily deposit mechanical energy into the surrounding medium. Accretion in these sources occurs at low rates, with Eddington fractions, fEdd, well below ∼1%. The HERGs, on the other hand, are believed to be dominated by the accretion of cold gas through a geometrically thin, optically thick disc (Shakura & Sunyaev 1973), similar to standard quasars. This population exhibits high accretion rates (fEdd > 0.01) and strong ionizing radiation, which can drive powerful outflows (Hardcastle et al. 2007; Miraghaei & Best 2017). Depending on the details of the Intracluster medium (ICM), radio jets and lobes of synchrotron-emitting plasma can extend in some cases to distances of several megaparsecs in both populations. A notable example is the LERG radio galaxy Alcyoneus, which extends across ∼5 Mpc (Oei et al. 2022). With the increased sensitivity and resolution of LOFAR, it has been shown that both classes can develop radio structures reaching megaparsec scales (Dabhade et al. 2020; Mingo et al. 2022).
Several studies have found differences in the clustering properties between LERG and HERG populations populations consistent with a picture in which LERG tend to inhabit denser environments than HERG, suggesting a strong dependence of their activity on the large-scale structure (Best 2004; Hardcastle 2004). Tasse et al. (2008) analysed the environments of faint, low-frequency radio sources at 0.1 < z < 1.2. with IRAC photometry and detected in the XMM-LSS Survey. They studied a mass-independent overdensity parameter to constrain both small (∼75 kpc) and large (∼450 kpc) -scale environments of radio sources. They presented evidence supporting a mass-driven dichotomy in which, at large scales, high-mass hosts with IR excess are found in overdense regions, whereas low-mass radio AGNs with IR active dust lie preferentially in underdense regions. Ineson et al. (2015) conducted a systematic environmental study of radio-loud AGNs at z ∼ 0.1 and z ∼ 0.5, using Chandra observations to probe cluster environments through the X-ray luminosity, richness, and central gas density. They found that LERGs exhibited strong correlations between radio luminosity and environmental metrics such as cluster X-ray luminosity, richness, and central density, while HERGs showed no such dependence. This supports models in which LERGs are fuelled by hot gas accreted from the ICM, whereas HERGs are fuelled by cold gas in local reservoirs via accretion discs. By comparing radio galaxies at z < 0.4 with control samples matched in stellar mass and colour and evaluating the local density estimator, Ching et al. (2017) found that moderately luminous LERGs reside in environments that are approximately three times denser than non-radio counterparts and are more likely to be group members. In contrast, HERG environments are statistically indistinguishable from their controls.
Hale et al. (2018) studied the clustering of radio AGNs in the COSMOS field at z < 1. Their analysis relies on the inversion of the angular correlation of radio sources, w(θ), converted into a spatial correlation, ξ(r), via the Limber equation (see Limber 1953; Peebles 1980) given a known redshift distribution, N(z), and after assuming a power-law dependence. They show that radiative inefficient accreters at zmed ∼ 0.7, roughly equivalent to the LERG population, are more clustered by a factor of ∼1.6 than efficient accreters (i.e. the HERG sources). This supports the idea that inefficient accreters are preferentially hosted in more massive dark matter halos, whereby the high temperature of gas would make it more difficult to fall into the central regions to be accreted. A recent study by Pan et al. (2025) investigated the projected association between optically selected galaxy clusters and LOFAR radio galaxies at z < 0.4 with optical counterparts from DESI Legacy Imaging Survey and WISE mid-infrared photometry. Their results indicate that HERGs preferentially reside near cluster centres, whereas LERGs tend to be more spatially dispersed.
In this study, we present new estimates of the clustering of HERG and LERG populations using the correlation function. Using this technique, we aim to quantify the large-scale environments of these AGNs and investigate potential differences in their spatial distributions. This approach allows us to assess whether HERGs and LERGs occupy distinct dark matter halos and whether their clustering properties correlate with other physical parameters such as radio luminosity and stellar mass.
The most visible impact of nuclear activity in its vicinity is well known by X-ray images of gas-rich and cool-core clusters that reveal giant cavities and shock fronts often filled with radio plasma lobes (Bîrzan et al. 2004, see McNamara & Nulsen 2012; Morganti 2017 for reviews). These are thought to be driven by jets whose energy can offset radiative losses, suppress gas cooling, significantly heat the ICM, and inhibit star formation in the host galaxy (Fabian 2012). Giant radio galaxies such as the ones mentioned before are examples of how AGN ejecta, powered by relativistic synchrotron emission, could potentially influence regions well beyond their host halos. However, robust observational evidence of the impact of such an effect on galaxies at megaparsec-scale distances is still lacking. Shabala et al. (2011) investigated neighbours of local (z < 0.2) radio AGNs in group and cluster environments, morphologically classified as FR-II (edge-brightened) or FR-I (core-dominated). For FR-II systems, galaxies lying within the projected jet paths, extending a few hundred kiloparsecs, were found to have systematically redder colours than those outside these regions. No comparable colour differences were detected in the FR-I neighbours. Pace & Salim (2014) analysed neighbouring galaxies within 100 kpc of RLAG at z < 0.3 and found a higher proportion of red, quenched systems around both FR-I and FR-II hosts than around controls, in all environments probed (field, cluster members, and brightest cluster galaxies). Shen et al. (2019) analysed radio AGNs in the ORELSE survey and found that neighbouring galaxies within a 500 kpc radius exhibited signs of suppressed star formation, likely due to AGN-driven heating of the surrounding gas. Using hydrodynamical simulations, Das & Pandey (2025) examined how proximity to an AGN affects star formation in nearby star-forming (SF) galaxies in a 2 Mpc radius and found modest evidence of suppressed star formation in massive, gas-poor galaxies in high-mass halos, consistent with thermal feedback inhibiting gas cooling, as well as enhancement of star formation in low-mass, gas-rich galaxies. Our work focuses on galaxies around AGNs. We aim to understand whether the presence of radio AGNs, likely through episodic outflows, can leave a statistical imprint on properties of neighbouring galaxies such as colour, luminosity, and stellar masses.
To achieve these objectives, we utilized extensive datasets from the Sloan Digital Sky Survey (SDSS), the NRAO VLA Sky Survey (NVSS), and the Faint Images of the Radio Sky at Twenty-Centimeters (FIRST). Through a detailed cross-correlation analysis of sources with spectroscopic redshifts, we measured the clustering of HERG and LERG populations and characterized the typical environment they inhabit. By comparing nearby photometric galaxies around these AGN populations with carefully selected control samples, we aim to assess the role of AGN feedback in shaping the properties of galaxies beyond their hosts.
This paper is organized as follows. In Section 2, we describe the datasets and sample selection criteria used in our study. Section 3 presents the clustering analysis of radio AGN environments using the projected cross-correlation function. In Section 4, we analyse the properties of galaxies surrounding LERGs and HERGs, with a focus on their colour and luminosity distributions. Finally, we summarize our results and discuss their implications for galaxy evolution in Section 5. Throughout this work, we assume a flat ΛCDM cosmology with parameters of Ωm = 0.3, ΩΛ = 0.7, and h = H0/(100 km s−1 Mpc−1). We present our measurements of the projected correlation function, ωp(rp), in units of h−1 Mpc and adopt h = 0.7 for estimating stellar masses and luminosities.
2. Survey data and sample selection
2.1. The SDSS catalogue
The Sloan Digital Sky Survey (York et al. 2000) is a spectro-photometric survey covering almost a quarter of the sky, providing five-band ugriz images and spectra for ∼1.6 million galaxies and ∼100k quasars. We have adopted SDSS model magnitudes, which are obtained from the best-fitting case between a de Vaucouleurs and an exponential profile in the r band, and applied reddening corrections from the dust maps by Schlegel et al. (1998). We also calculated k-corrected magnitudes and colours following the method by Chilingarian et al. (2010).
In Section 4 we analyse the properties of nearby galaxies around an AGN. For that purpose, we obtained a sample of galaxies with photometric redshifts estimated by Beck et al. (2016). Using a hybrid method of machine learning and template fitting techniques, they estimated redshifts for SDSS photometric galaxies using the SDSS spectroscopic catalogue as a training sample, augmented with photometric sources cross-matched with deeper spectroscopic surveys. These photometric redshifts are accurate up to z ∼ 6, achieving an average bias of 5.84 × 10⁻⁵(1), a standard deviation of  , and an outlier rate of 4.11%.
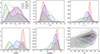 |
Fig. 1. Main physical properties (redshift, r-band absolute magnitude, colour, D4000 index, stellar mass) of our spectroscopic SDSS galaxy sample (grey), LERGs (red), HERGs (blue), and unclassified radio sources (UNCs, green). The lower right panel shows their location in the colour-magnitude diagram. |
2.2. The MPA-JHU, NVSS, and FIRST catalogues
Based on SDSS data, the Max Planck Institut für Astrophysik (MPA) along with the John Hopkins University (JHU)2 produced a catalogue of re-reduced galaxy spectra with improved estimates of absorption indexes and emission-line fluxes after carefully subtracting the stellar continuum. The MPH-JHU catalogue of galaxy physical properties comprises accurate estimates of stellar masses, star formation rates, 4000 Å break strengths, AGN classification based on Baldwin-Phillips-Terlevich (BPT) diagrams (e.g. Baldwin et al. 1981), and the AGN luminosity traced by the O[III] 5007 Å emission line (Kauffmann et al. 2003; Zakamska et al. 2003; Heckman et al. 2004).
The NVSS (Condon et al. 1998) is a 1.4 GHz radio continuum survey observed by the Very Large Array (VLA) of the National Radio Astronomy Observatory covering latitudes north of −40 deg with an angular resolution of 45″. The derived catalogue consists of ∼26 sources with flux densities higher than 2.5 mJy, comprising radio galaxies, quasars, low-luminosity AGNs, pulsars, and stars.
The Faint Images of the Radio Sky at Twenty cm (FIRST, Becker et al. 1995) is a radio survey at a frequency of 1.4 GHz, observed with the VLA with a resolution of 5″. It covers about 10 500 deg2 from the sky, mostly overlapping with the SDSS footprint. Its resulting catalogue contains ∼946 000 radio sources with flux densities above 5 mJy. Combined together, NVSS and FIRST are very useful for characterizing radio sources, as the former has a higher sensitivity to extended emission, while the latter allows one to accurately identify the host galaxy due to its higher spatial resolution.
2.3. The radio AGN samples
The radio galaxy sample utilized in this work was selected from Best & Heckman (2012), who combined the aforementioned optical and radio surveys with the techniques described by Best et al. (2005) and the improvements by Donoso et al. (2009) for the identification of sources without FIRST counterparts. They produced a cross-matched catalogue of 18286 radio sources with optical identifications and reliable emission-line classification.
In order to distinguish between radio emission due to star formation and radio emission due to AGN activity, Best & Heckman (2012) employed the combination of three methods. The first one uses the D4000 break strength versus radio luminosity (Lrad) per unit stellar mass. The AGNs show enhanced values of Lrad, while in SF galaxies the radio emission due to stars depends rather on the specific star formation rate. The second method is based on the relation between Hα and Lrad. It is natural to expect a correlation between those parameters in SF galaxies, while the extra emission from the AGN shifts these objects to higher Lrad. The third method employs the standard [OIII]/Hβ versus [NII]/Hα plane to separate the SF sequence from the AGN population with the dividing boundary as of Kauffmann et al. (2003). Most radio sources can be readily classified by one of these methods (83%, 80%, and 30% coverage, respectively), with some incompleteness affecting objects above z > 0.3, or without stellar masses or reliable measurements of emission lines.
The separation between high-excitation and low-excitation radio populations is more complex, and hence worth describing briefly here. Buttiglione et al. (2010) defined an excitation index (EI) as a combination of four emission line ratios constructed from six emission lines ([OIII], Hβ, [NII], Hα, [SII], and [OI]). Although a limiting value of EI = 0.95 can efficiently separate HERGs and LERGs, in many cases the complete set of line measurements is not available or is just too noisy. Best & Heckman (2012) adopt a cascading approach to classification starting from the ideal cases where all six lines are available, followed by those with only four BPT lines, then by those with significant [OIII emission (classified as HERGs)], repeating these criteria without applying a 1σ safety distance from the corresponding division boundary, and finally by its location in the [NII]/Hα versus [OIII]/Hα diagnostic plot of Cid Fernandes et al. (2010).
Even after using all these methods, a fraction of the cross-matched sources cannot be securely classified into HERGs and LERGs. Here, these are referred to as unclassified sources (UNCs) and we refer the reader to Table A.1 from Best & Heckman (2012) for further details and an exhaustive list of all possible combinations.
In this work, we are interested in the environments of radio AGNs in the local Universe, so we restrict ourselves to objects within the main SDSS galaxy sample, with redshifts between 0.03 < z < 0.3 and r-band magnitudes between 14.7 < r < 17.77. After excluding a few objects with non-physical values of magnitudes, colours, or stellar masses, this gives us a catalogue of 8691 radio sources, of which 7069 are radio AGNs. In Figure 1 we present the main physical properties of our samples of LERGs (5807 objects), HERGs (215 objects), UNCs (2669 objects), and its parent SDSS galaxy sample (GAL).
In Figure 1 we show the redshift distribution, stellar mass, absolute magnitude, colour, and D4000 absorption index of our AGN samples, as well as SDSS non-active galaxies. As a reference, we also include their positions in the u − r versus Mr colour-magnitude diagram. While there is no significant difference in redshift between high- and low-excitation sources, LERG are in general more luminous, substantially redder, more massive, and dominated by older stars than HERG objects. The UNC sources show a clear bimodality in all these properties, suggesting that they are composed by a mixture of populations that extends toward the SF sequence at low redshifts. On a statistical basis, radio luminosity is a potential proxy for jet power. Figure 2 compares the radio luminosity distribution of AGNs in our dataset. We can appreciate that, while both populations extend from ∼1022 W Hz−1 to ∼1026 W Hz−1, HERG are moderately biased towards higher luminosities. Their mean radio powers are ⟨P1.4 GHz⟩ = 1023.7 W Hz−1 (HERG) and ⟨P1.4 GHz⟩ = 1024 W Hz−1 (LERG). In the figure, we also show a control sample for HERGs built from LERGs matched in radio luminosity and various properties, which we describe in detail in the following subsection.
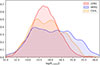 |
Fig. 2. Distribution of radio luminosity of HERG (blue) and LERG (red) sources, as well as a control sample for the former built from low-excitation objects matched in various properties (CSHL, orange, see Section 2.4 for details). |
2.4. Control samples
Apart from the obvious change due to redshift, it is well known that clustering depends on the physical properties of the galaxies considered, such as luminosity, colour, and morphology (Norberg et al. 2002; Li et al. 2006; Coil et al. 2008; Meneux et al. 2008; Zehavi et al. 2011). This has led to a well-established observational picture whereby galaxy clustering on all scales is higher as luminosity or stellar mass increases. Likewise, as stars evolve and galaxy colours become redder, the clustering signal again increases, particularly on small scales. In fact, the steepening and increase in correlation length for redder and more massive galaxies have been linked to their increased preference (i.e. fraction) to be found as satellite systems in high-mass halos (Zehavi et al. 2005; Yang et al. 2005; Abbas & Sheth 2006; Skibba et al. 2009; Guo et al. 2014).
Hence, to make a fair comparison between different types of AGNs, we constructed two groups of control samples. The first group was built from galaxies that match an LERG or HERG. We selected (when possible) five non-active galaxies for each AGN with a tolerance of Δz = 0.03 in redshift, Δlog(M*/M⊙) = 0.1 in stellar mass, Δ(U − R) = 0.1 in (k-corrected) colour index, and ΔD4000 = 0.1 in the spectral index that accounts for the age of the stellar population. In this way, the key physical differences between AGN hosts and normal galaxies are accounted for, highlighting the effect due to the presence or absence of nuclear activity. Matching in redshift not only accounts for evolutionary effects, but also minimizes possible biases due to fiber spectra sampling light from different physical scales. Our control samples for HERGs (CSH) and LERGs (CSL) comprise 994 and 26 423 galaxies, respectively, and their relevant properties are compared in Figures 3 and 4.
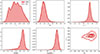 |
Fig. 3. Same as Fig. 1, but for our LERGs (red) and its matched control sample of non-active galaxies (CSL, dark red). |
The second group of control samples are built from the AGNs themselves. For each HERG in our sample, we selected a matching LERG with properties within Δz = 0.05, Δlog(M*/M⊙) = 0.2, Δ(log(P1.4 GHz)) = 0.25, and ΔD4000 = 0.2. We refer to this sample as CSHL and their relevant properties distributions are shown in Figure 4.
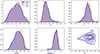 |
Fig. 4. Same as Fig. 3, but for high-excitation radio galaxies (HERG, blue) and its matched control sample of non-active galaxies (CSH, light blue), as well as its control sample selected from LERG sources (CSHL, orange). |
3. Clustering analysis
3.1. Projected cross-correlation function
The two-point correlation function (2PCF) is a key statistical tool that allows one to characterize and quantify the clustering level of any point process. The probability, dP, of finding two objects in volume elements dV1 and dV2 separated by a distance, r, is ![Mathematical equation: $ dP=\overline{n}^2[1+\xi(r)] dV_{1}dV_{2} $](/articles/aa/full_html/2026/01/aa54346-25/aa54346-25-eq2.gif) , where
, where  is the mean number density, and ξ(r) is the spatial correlation function. It can be immediately seen that ξ > 0 quantifies the departure from a homogeneous Poisson point process (ξ = 0), where probabilities are independent of the locations of the particles.
In the literature, several estimators have been proposed to estimate the 2PCF from counts of galaxy pairs detected in surveys. A frequently used expression developed by Davis & Peebles (1983) is ξ(r) = DD(r)/RR(r)−1, where DD(r) and RR(r) are number of pairs separated by a distance, r, in the observed galaxy sample and a synthetic sample where galaxies are distributed randomly. When working with pairs from different samples of galaxies, a similar estimator for the cross-correlation function (2PCCF) can be written as ξ(r) = CD(r)/CR(r)−1, where CD(r) and CR(r) now stand as the cross-counts between two samples C and D, and C and R, respectively. The latter refers to the random sample constructed for the D sample. This particular form has two key advantages: (i) it cancels out the selection effects of the C sample, which can be complex to model or even unknown, and (ii) the random sample only needs to follow the selection function of sources in D. In this work, the random sample is built from a modified version of the masks from the New York University Value-Added Galaxy Catalog (NYU-VAGC), created by Blanton et al. (2005).
The spatial separation, r, between galaxies can be decomposed in two directions: one perpendicular to the line of sight (rp) and the other in the radial direction (π). In this way, the two-dimensional 2PCCF can be written as
 (1)
(1)
As the peculiar velocity component of galaxies affect measurements along the line of sight, the so-called redshift-space distortions can modify the shape of correlations at both small (i.e. finger-of-god effect) and large scales (i.e. Kaiser effect). To minimize such distortions, it is possible to integrate the two-dimensional 2PCCF in the line-of-sight direction to obtain the projected correlation function, wp(rp):
 (2)
(2)
where the integration limit, πmax, can be chosen as a compromise between values too low that would exclude correlated pairs leading to noisy estimates and values too large that would waste the information encoded by the redshift.
The CF provides a way to characterize the distribution of matter in the Universe, as its shape reveals information about the environment in which the galaxies are immersed. On small scales, the CF is sensitive to processes such as galaxy interactions and mergers, while on intermediate scales it traces how galaxies are clustered within dark matter halos. On large scales, the CF starts to follow the large-scale structure so that its amplitude can trace, for example, the mass of the typical dark matter halos hosting a given galaxy population (see Coil 2013 for a review). To estimate the pair counts and correlation functions in this work, we employed GUNDAM3 (Donoso 2019), a hybrid Fortran-Python package that counts galaxy pairs in various geometries using high-performance algorithms based on linked-lists and skip-lists.
3.2. Clustering results
In the first part of this paper, we analysed the environments of LERGs, HERGs, and UNCs using the 2PCCF. We cross-correlated each sample of radio AGNs and all of its control sources with the main SDSS spectroscopic sample, after excluding radio sources. Fig. 5 shows 2PCCF estimates for LERGs, HERGs, and unclassified objects, with the shaded area indicating the bootstrap error (Barrow et al. 1984). As we can see, there are significant differences in clustering among the three populations of radio galaxies (we defer the analysis of UNC sources to Appendix A). In general, we find LERGs with clustering amplitudes ∼1.5 to ∼3 times higher than the amplitudes of HERG. Several works (Hardcastle 2004; Tasse et al. 2008; Miraghaei & Best 2017; Ching et al. 2017; Hale et al. 2018) suggest that LERGs inhabit environments with a higher galaxy density than HERGs, and our results are broadly consistent with such a scenario. For the case of LERGs, the one-halo and two-halo terms, characteristic of pairs within a single dark matter halo or in two different ones, are clearly visible. The difference between both AGN populations is substantially higher on small scales (rp < 1 − 2 h−1 Mpc), precisely the typical radius of moderately rich galaxy clusters at these redshifts (Hansen et al. 2005). Even so, LERGs display an average clustering about 1.5−2 times higher than HERGs on large scales, which would suggest a difference between the masses of their typical dark matter halos. Although in a different redshift range (zmed ∼ 0.7), these results agree with Hale et al. (2018) analysis of COSMOS radio AGNs, who found that MLAGNs (radiatively inefficient, roughly equivalent to our LERG population) have a higher bias value (factor of ∼1.6) and prefer to be hosted by more massive dark matter halos (by factors of ∼1.5 − 4) with respect to HLAGNs (analogues of HERGs).
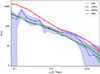 |
Fig. 5. Projected cross-correlation function between SDSS galaxies and LERGs (red), HERGs (blue), and radio sources without classification (green). For reference, we also show the autocorrelation of SDSS galaxies (grey). |
However, a fraction of this effect could potentially disappear when we take into account the physical properties of their host galaxies. In Figure 6 we plot the cross-correlations of the control samples described above. We find a small decrease in the amplitudes of LERG controls (CSL, dashed red curve), while there are no significant systematic changes for HERG controls (CSH, dashed blue curve). These trends are similar to the findings of Ching et al. (2017), albeit with a slightly different methodology. They compared LERG and HERG environments against non-radio control samples matched in stellar mass and rest-frame colour, using the fifth nearest neighbour density (Σ5) as a local density estimator. They found that luminous LERGs (P1.4 GHz > 1024 W Hz−1) inhabit environments several times denser than their controls. In contrast, HERGs, show environmental properties that are statistically indistinguishable from those of matched normal galaxies. Our clustering analysis reveals the same qualitative behaviour.
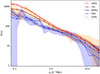 |
Fig. 6. Projected cross-correlation function between SDSS galaxies and LERGs (red), its control of non-active galaxies (CSL, dark red), HERGs (blue), its control sample of non-active galaxies (CSH, dark blue), as well as the HERG control sample selected from LERG sources (CSHL, orange). |
When we consider low-excitation sources matched to the physical properties of HERGs (CSHL, dashed yellow curve), we observe a slight steepening of the PCCF for spatial scales roughly inside the one-halo term. This could mean that independently of host properties, LERGs are more likely to be found as group or cluster central galaxies than HERG, as has been found by Thomas & Davé (2022) in hydrodynamical simulations (see the discussion in Section 5). We have repeated the calculations with another control sample that CSHL matched in redshift, stellar mass, D4000 index, and colour, obtaining qualitatively very similar results.
Our findings align well in several aspects with the X-ray study by Ineson et al. (2015). They reported strong positive correlations between radio luminosity and environmental metrics for LERG at z ∼ 0.1, but no such dependence for HERG, interpreting this as evidence that LERGs are predominantly fuelled by hot gas accreted from the ICM, whereas HERGs rely on cold gas from local reservoirs. In our samples, LERGs also occupy denser environments than HERGs, and this trend persists when controlling for host galaxy properties and radio power. Our work measures large-scale galaxy clustering rather than direct ICM properties, but both approaches point to a consistent environmental dichotomy between the two AGN classes. However, it should be noted that in some cases the two methods could be probing different spatial scales, since the X-ray profiles are integrated up to R500 (around 300−800 kpc), while clustering estimates range from kiloparsecs to several megaparsecs.
3.3. Dependence on stellar mass and radio luminosity
As stellar mass can be a major parameter driving the clustering signal across different types of objects, we need to factor out its effect to make a fair statistical comparison. Therefore, we split our LERG AGNs into three subsamples: low-mass or M1 (log(M/M⊙) < 11.2), intermediate-mass or M2 (11.2 ≤ log(M/M⊙) < 11.5), and high-mass or M3 (log(M/M⊙)≥11.5). Likewise, we divided our HERG AGNs into two mass bins: low-mass or M1 (log(M/M⊙) < 11.2) and high-mass or M2 (log(M/M⊙)≥11.2). This is so to retain a reasonable number of sources in each bin and to keep the PCCF noise under control, particularly for the less dense population of HERG. As before, for each subsample we built a unique control sample drawn either from normal galaxies or the low-excitation sources.
The corresponding PCCF estimates are shown in Fig. 7. The expected behaviour is that more massive galaxies are found in more dense environments, which is precisely what we find for LERGs: the most massive LERGs in our sample display the highest cross-correlation signal with respect to the least massive LERGs, with the total sample located somewhere between the two (dashed red curves). In the case of HERGs, the behaviour is strikingly different. The least and most massive HERGS show fairly similar clustering strengths, i.e. there is an apparent independence with respect to stellar mass. In fact, although the noise is significant, there are indications that the most massive HERGs are preferentially found in less clustered, large-scale environments.
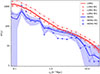 |
Fig. 7. Projected cross-correlation function of LERG (red), HERG (blue), LERG subsamples split in three bins of stellar mass (red symbols, see text), and HERG subsamples split in two bins of stellar mass (blue symbols). |
To quantify these trends in more detail, we fitted two power laws to each PCCF, one on small scales (0.1 h−1 Mpc < rp < 1.0 h−1 Mpc) characteristic of the one-halo term, and the other on large scales (1.0 h−1 Mpc < rp < 10 h−1 Mpc) that are proper of the two-halo term. For the fitting, we adopted the functional form Accrpα, where Acc is the cross-correlation amplitude and α is the slope. In general, we let both parameters vary, but for some subsamples split in mass or radio power, we performed a second fit with α fixed to the complete sample before splitting. The results of these numerical fits are listed in Table 1. As is shown in Fig. 8, for both spatial scales we then plotted the amplitude versus the stellar mass, which is defined from the average mass of each subsample. It is clear that at fixed stellar mass, the clustering strength of LERGs (solid red) is higher than that of HERGs (solid blue) throughout all mass bins and scale distances considered. We can also see that massive LERGs, i.e. above log(M/M⊙)∼11.2, are more clustered than inactive galaxies of the same mass, colour, redshift, luminosity, and D4000 strength. It is intriguing that this effect is somewhat reversed for HERG, as they seem to prefer less dense environments than their matched control galaxies. However, we should consider this result with care, as the small population of HERG might suffer from low-number statistics and could be more affected by incompleteness. Furthermore, it is quite possible that a fraction of sources in the UNC category, which could not be reliably classified from SDSS spectra alone, are indeed members of HERG or LERG populations. In Appendix A we analyse the clustering of these radio sources without classification, divided into UNCs of AGN type (UNC-agn), UNCs of SF type (UNC-sf), and the subsample of UNC-sf objects with high D4000 values (UNC-sf-D4000).
Power-law cross-correlation amplitudes and slopes for the analysed samples.
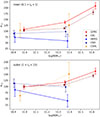 |
Fig. 8. Top: Cross-correlation amplitude as function of stellar mass for our samples of LERGs, HERGs, and their corresponding control samples, restricted to the inner region (0.1 < rp < 1 h−1 Mpc). Bottom: Same as upper panel, but restricted to the outer region (1 < rp < 10 h−1 Mpc). |
These results above can be broadly compared with those in Tasse et al. (2008), who quantified the environments of z ∼ 0.7 radio AGNs in the XMM-LSS field by the overdensity of nearby galaxies around them, normalized by the mean overdensity around control (non-radio) galaxies matched in stellar mass and redshift (see their Fig. 9). They found that the relative overdensity increases strongly with stellar mass at scales of ∼0.5 Mpc, with the most massive hosts residing in environments that are significantly denser than those of normal galaxies. In contrast, low-stellar-mass radio AGNs were biased towards ∼0.5 Mpc underdensities, and overdensities below ∼100 kpc. Although their analysis did not distinguish between excitation classes, this mass dependence is consistent with our finding that LERGs – typically hosted by more massive galaxies – show clustering amplitudes higher than those of HERGs. Our measurements extend this picture, suggesting that, even at a fixed stellar mass, excitation class is an important predictor of environmental richness.
It is also worth mentioning that LERG objects selected as controls of high-excitation AGNs (dotted yellow line) show cross-correlation amplitudes similar to LERGs rather than following the values of HERGs, particularly up to ∼1−2 h−1 Mpc. Such an effect supports the idea that the close-to-medium-scale environments of both AGN populations are very different, independent of the properties of the host galaxies.
Radio power is another key physical parameter closely related to the actual injection of energy into the medium. As before, we split our AGN samples into bins of radio luminosity at 1.4 GHz, with three bins for LERGs (log(P)≥24.4 W Hz−1, 23.6 ≤ log(P) < 24.4 W Hz−1, log(P) < 23.6 W Hz−1), and two bins for HERG sources (log(P)≥23.9 W Hz−1, log(P) < 23.9 W Hz−1). Again, we calculated power-law fits at two distinctive scales; we plot the resulting ACC as function of radio luminosity in Figure 9. Our population of LERGs show a positive correlation: more luminous LERGs are more clustered than less powerful ones at all scales. This contrasts with high-excitation sources, whose cross-correlation function remains relatively constant with radio power. These results are consistent with several works (Donoso et al. 2010; Ineson et al. 2015; Ching et al. 2017) despite employing different methodologies on different samples in a range of redshifts (all below z ∼ 1). Barthel & Arnaud (1996) proposed that radio sources embedded within rich cluster environments exhibit elevated radio luminosities due to the enhanced confinement of their relativistic plasma by the dense ICM, which suppresses adiabatic losses and effectively boosts the observed emission. An alternative (or complementary) explanation is that more powerful jets are simply a natural consequence of higher local cooling rates in dense environments. We can also observe that control (normal) galaxies of the same mass, redshift, colour, optical luminosity, and D4000 index as LERG objects seem to prefer significantly less dense environments (dotted red curve), except perhaps at our lowest radio luminosities. Such a contrasting behaviour between AGNs and control galaxies is, once again, different in the case of HERGs, as we do not observe major differences between those active nuclei and their matched inactive galaxies (dotted blue curve).
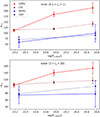 |
Fig. 9. Top: Cross-correlation amplitude as function of radio luminosity for our samples of LERGs, HERGs, and their corresponding control samples, restricted to the inner region (0.1 < rp < 1 h−1 Mpc). Bottom: Same as upper panel, but restricted to the outer region (1 < rp < 10 h−1 Mpc). We plot control curves at the same radio power of its corresponding radio active sample. |
The dependence of the cross-correlation amplitude on radio luminosity that we find for LERG, whereby the clustering strength increases markedly toward higher powers, bears a qualitative resemblance to the trends of Pan et al. (2025) (see their Fig. 5). They find that the fraction of LERGs matched to galaxy clusters rises steeply with radio power, whereas HERGs show an almost flat relation, consistent with the mild variation in clustering amplitude across the luminosity range of our HERG sample. A similar dichotomy emerges when considering the morphological–spectral classification of Lin et al. (2010), whose subset of massive hosts in dense environments with weak emission lines (their a< 0.8) resembles our LERG population, and whose sources with lower-mass hosts in poorer environments and high [O II] λ5007 luminosities (their a0.9, em) are similar to our HERG objects.
Importantly, both works described above relied on samples of extended radio galaxies or data with high sensitivity and resolution (e.g. LOFAR), yet our study reproduces fairly consistent environmental trends using more limited survey data, underscoring the robustness of the dichotomy between LERG and HERG environments even without those observational advantages. Taken together, all these independent results reinforce a coherent picture in which LERGs at high radio power are preferentially associated with massive halos, reflecting hot-mode accretion from dense intracluster gas, while HERGs maintain similar large-scale environments regardless of radio luminosity, indicative of fuelling through localized cold gas reservoirs.
4. Neighbouring galaxies of radio AGNs
In this section, we conduct a comparative analysis of the u − r colour and Mr absolute magnitude distributions of neighbouring galaxies around both populations of radio AGNs. To ensure a relatively clean selection of galaxies typically associated with cluster or galaxy group environments, we constrain the galaxy samples to rp < 2 h−1 Mpc and ΔV < 5000 km s−1 with respect to the central source. This allows us to include most true neighbours, while minimizing the intrusion of background and foreground sources. With these constraints, we identify 13217 neighbours of HERGs (N-HERGs) and 433 204 neighbours of LERGs (N-LERGs). As before, we also study the neighbours of each (inactive) control galaxy matched to our samples of AGN, composed of 30 758 neighbours of HERG controls (N-CSHs) and 894589 neighbours of LERG controls(N-CSLs).
In order to quantify possible differences among neighbouring galaxies, we analysed the mean of their distributions across a set of rp values, while estimating its precision by bootstrap resampling (Barrow et al. 1984). We performed some comparisons in three bins of stellar mass and the radio power of our AGN populations as well as their corresponding control objects. These comparisons were carried out with hypothesis testing, employing the Kolmogorov-Smirnov (KS) test and Mann-Whitney U (MWU) test.
4.1. Colours and luminosities of neighbours
The u − r colour distribution of samples N-HERG, N-LERG, N-CSH, and N-CSL is depicted in Figure 10 for rp < 2 h−1 Mpc (left panel) and rp < 1 h−1 Mpc (middle panel). It can be seen that, on both scales, LERG neighbours exhibit redder colours compared to other samples. The effect is subtle, yet discernible, and the case of HERG neighbours is certainly a bit more challenging to analyse. In the right panel, we trace the mean of the colour distributions as a function of the projected radius. In all cases, as we consider smaller environments centred around the AGN or control objects, their neighbour galaxies become increasingly red, while at about rp ∼ 2 h−1 Mpc they become almost identical. Malavasi et al. (2015) also found a similar strengthening of environmental effects around radio AGNs when restricting the scales from 2 to 1 Mpc. This is most likely because, when adopting a smaller scale, only the central regions of the bound structures are considered. Compared to HERGs, LERGs are surrounded by redder galaxies. This is not surprising considering the well-known correlation between galaxy type and local density (Dressler 1980), and is also consistent with our results from the cross-correlation analysis. Interestingly, the environment of LERG control galaxies is bluer than the one of LERGs, whereas the galaxies around HERG controls are indistinguishable from those around HERGs.
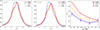 |
Fig. 10. Normalized u − r colour distributions for two scales (rp < 2 h−1 Mpc, left panel; rp < 1 h−1 Mpc, middle panel), corresponding to neighbours of LERG AGNs (N-LERGs, solid red), neighbours of HERG objects (N-HERG, dash-dotted blue), neighbours of the LERG control sample (N-CSL, dashed orange), and galaxies around HERG control sources (N-CSH, dotted purple). We smoothed the curves using a continuous probability density curve (KDE) with the smoothing bandwidth parameter set to 0.15. The right panel shows the mean colour as a function of rp. |
In Figure 11 we present the normalized distributions of the r-band absolute magnitude and the variation in its mean as a function of distance. It can be seen that LERG neighbours appear consistently brighter than those of HERG, particularly with decreasing radius from the AGN. However, galaxies around LERG controls are slightly less luminous than around LERGs and are weakly dependent on radius. In contrast, the environment around HERG controls is a bit more luminous than around HERGs and actually becomes fainter with decreasing distance.
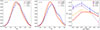 |
Fig. 11. Normalized distributions of r-band absolute magnitude and its mean value as function of distance, for neighbour galaxies around AGNs and control objects (samples, colours, and styles as in Figure 10). |
4.2. Statistical tests
To assess whether the properties of neighbour galaxies around different types of AGNs differ in a statistically significant way, we performed a KS test on the distributions of the u − r colour and the Mr absolute magnitude. Although the KS test proves to be particularly effective in many applications, it is not ideal for comparing two empirical distributions. Hence, we complemented our analysis with the MWU test, specifically tailored for that case. The comparisons were conducted for neighbouring galaxies of HERGs and LERGs, as well as against their respective control samples, across bins of stellar mass and radio luminosity. The results are summarized in Table 2. Low p values indicate significant differences between the compared samples.
Statistical tests of neighbouring galaxy properties.
It is clear that the KS and MWU values when comparing the colour of LERG neighbours against HERG neighbours are below or very close to the decision threshold (p = 0.05) across the entire stellar mass range. This means environments around both types of AGNs are statistically different in terms of colour. The same conclusion applies when comparing galaxies around LERGs against those around their control objects. In contrast, the distribution of galaxy colours around HERG and HERG controls does not change significantly. In the case of radio power, we encounter similar results: neighbours of LERG and HERG have different colours for all radio luminosities in our sample.
When we compare instead the distributions of optical luminosities, the picture is slightly more complicated. Neighbours of LERG and LERG controls are still different, and so are the neighbours around LERGs versus those surrounding HERGs, except at the high-mass end. The opposite seems true for galaxies around HERGs and HERG controls, which start to be indistinguishable near the low-mass end. As before for the u − r colour, at any radio power considered, the optical luminosities of galaxies around high- and low-excitation AGNs are statistically different. The general trends observed in our earlier analysis are preserved: neighbouring galaxies of LERGs are significantly redder and brighter than those around HERGs, particularly in high-mass or high-luminosity bins. These differences are less pronounced or absent when comparing each AGN type to their control samples.
It is interesting to broadly compare at least some of these trends with the results of Shen et al. (2019), who investigated the fraction of quiescent neighbour galaxies within 500 kpc of radio AGNs at z ∼ 0.9. They found a statistically significant excess of quenched neighbours in the densest environments compared to matched non-radio controls, particularly for AGNs in cluster cores and massive cluster galaxies, which they interpret as tentative evidence of AGN-driven heating of the surrounding gas. Although their sample neither distinguishes between LERGs and HERGs nor analyses galaxy colours in detail, their results complement ours by suggesting that radio AGNs can potentially imprint measurable changes in the properties of surrounding galaxies. Our finding that LERG environments host systematically redder and more massive neighbouring galaxies than HERG, even at fixed host properties, may represent low-redshift evidence supporting a similar feedback or environmental quenching process to the one suggested by Shen et al. (2019).
5. Conclusions
In this study, we present clustering measurements of high-excitation (HERG) and low-excitation (LERG) radio galaxies using the projected cross-correlation function with respect to spectroscopic galaxies at z < 0.3. In addition, we also performed a comparative analysis of the colour and luminosity distributions of their environments as traced by photometric neighbour galaxies. Our results reveal some significant differences between these AGN populations in terms of their clustering properties, environmental dependencies, and the characteristics of nearby galaxies. These can be summarized as follows:
-
We find that LERGs exhibit a higher clustering amplitude than HERGs on all scales, with the most pronounced differences occurring at small to intermediate distances (rp < 1 − 2 h−1 Mpc). This suggests that LERGs are predominantly found in denser environments, such as galaxy clusters or groups, and hosted by more massive dark matter halos. Even after controlling host properties (CSHL sample), HERGs preferentially reside in lower-density regions. This supports previous findings that LERGs are usually associated with hot, X-ray emitting ICM where radio-mode AGN feedback is postulated to play a dominant role in regulating galaxy evolution in massive systems. It is interesting that LERG clustering increases with stellar mass, while HERGs show little or no dependence, and may even exhibit a mild decrease for its most massive specimens (log(M/M⊙)∼11.3 − 11.4). Such environmental richness being a stronger function of stellar mass for LERGs than for HERGs has been found in other works (Tasse et al. 2008; Ching et al. 2017), but also agrees with more theoretical findings based on hydrodynamical simulations (e.g. Thomas & Davé 2022, see below).
-
Except at our low-mass bin (⟨log(M/M⊙)⟩ ∼ 11), LERGs are more clustered than non-active galaxies of the same redshift, mass, colour, luminosity, and stellar population age. In contrast, high-excitation AGNs preferentially inhabit underdense regions when compared to matched normal galaxies.
-
This is consistent with the effect observed in radio luminosity. At fixed radio power, LERGs are significantly more clustered than HERGs and follow a positive correlation with radio luminosity. Radio emission in HERGs seems to be unrelated to its surrounding environment.
-
The LERG neighbours are systematically redder, more luminous, and likely more massive than those around HERGs, and the effect on colour persists even when compared with control environments around non-active matched galaxies. In contrast, HERG neighbours show no significant differences from those of their control samples. Although the magnitude of this bias is subtle, our findings provide some evidence that AGN feedback could influence galaxies in the broader megaparsec-scale environment, particularly in the case of low-excitation sources.
These results are broadly consistent with the findings of Thomas & Davé (2022) based on the SIMBA cosmological hydrodynamical simulation (Davé et al. 2019). SIMBA includes recipes for hot gas accretion (i.e. Bondi), cold gas accretion (i.e. via gravitational torque), and feedback by kinetic winds from black holes, jets, and high-energy X-rays. Their classification into LERG and HERG populations is based on the dominant accretion model; that is, hot or cold accretion, derived from the instantaneous Eddington ratio averaged over 50 Myr. Their analysis indicates that radio-mode AGNs are mainly found in high-mass halos and dense environments, where the steep correlation functions arise from increased satellite fractions. Despite a rather weak correlation correlation between jet luminosity and quenching, they find that the quenching of satellite galaxies is prominent around LERGs, leading to redder and more passive populations, just as we find for neighbouring galaxies around real LERGS. Likewise, their simulated HERGs at z ∼ 0 seem to have a weaker environmental impact and prefer under-dense regions. Moreover, their work indicates that the environmental richness of radio AGNs follows a mildly decreasing trend with decreasing radio luminosity, particularly below ∼1024 W Hz−1. This is consistent with the decrease in the correlation amplitude for LERGs, while the clustering of HERGs is less sensitive to radio power.
These results reinforce the importance of environmental factors in shaping AGN activity and suggest that different AGN accretion modes could lead to different medium to large-scale clustering and feedback mechanisms. Additionally, environmental influences appear to extend beyond the AGN host, affecting at least the colour and luminosity properties of neighbouring galaxies. Future studies incorporating deeper and wider radio surveys cataloguing larger samples of high-excitation radio galaxies and using multi-wavelength data will be crucial for further understanding the interplay between AGNs, their hosts, and the surrounding large-scale environment.
Acknowledgments
The authors thank U. Sureshkumar and M. Dominguez for valuable discussions and comments on this work. We also thank the anonymous referee for useful comments and suggestions that enriched this manuscript.
References
- Abbas, U., & Sheth, R. K. 2006, MNRAS, 372, 1749 [Google Scholar]
- Baldwin, J. A., Phillips, M. M., & Terlevich, R. 1981, PASP, 93, 5 [Google Scholar]
- Barrow, J. D., Bhavsar, S. P., & Sonoda, D. H. 1984, MNRAS, 210, 19 [Google Scholar]
- Barthel, P. D., & Arnaud, K. A. 1996, MNRAS, 283, L45 [NASA ADS] [CrossRef] [Google Scholar]
- Beck, R., Dobos, L., Budavári, T., Szalay, A. S., & Csabai, I. 2016, MNRAS, 460, 1371 [Google Scholar]
- Becker, R. H., White, R. L., & Helfand, D. J. 1995, ApJ, 450, 559 [Google Scholar]
- Best, P. N. 2004, MNRAS, 351, 70 [NASA ADS] [CrossRef] [Google Scholar]
- Best, P. N., & Heckman, T. M. 2012, MNRAS, 421, 1569 [NASA ADS] [CrossRef] [Google Scholar]
- Best, P. N., Kauffmann, G., Heckman, T. M., et al. 2005, MNRAS, 362, 25 [Google Scholar]
- Bîrzan, L., Rafferty, D. A., McNamara, B. R., Wise, M. W., & Nulsen, P. E. J. 2004, ApJ, 607, 800 [Google Scholar]
- Blanton, M. R., Schlegel, D. J., Strauss, M. A., et al. 2005, AJ, 129, 2562 [NASA ADS] [CrossRef] [Google Scholar]
- Bower, R. G., Benson, A. J., Malbon, R., et al. 2006, MNRAS, 370, 645 [Google Scholar]
- Buttiglione, S., Capetti, A., Celotti, A., et al. 2010, A&A, 509, A6 [NASA ADS] [CrossRef] [EDP Sciences] [Google Scholar]
- Chilingarian, I. V., Melchior, A.-L., & Zolotukhin, I. Y. 2010, MNRAS, 405, 1409 [Google Scholar]
- Ching, J. H. Y., Croom, S. M., Sadler, E. M., et al. 2017, MNRAS, 469, 4584 [NASA ADS] [CrossRef] [Google Scholar]
- Chon, G., Puchwein, E., & Böhringer, H. 2016, A&A, 592, A46 [NASA ADS] [CrossRef] [EDP Sciences] [Google Scholar]
- Cid Fernandes, R., Stasińska, G., Schlickmann, M. S., et al. 2010, MNRAS, 403, 1036 [Google Scholar]
- Coil, A. L. 2013, in Planets, Stars and Stellar Systems. Volume 6: Extragalactic Astronomy and Cosmology, eds. T. D. Oswalt, & W. C. Keel, 6, 387 [NASA ADS] [CrossRef] [Google Scholar]
- Coil, A. L., Newman, J. A., Croton, D., et al. 2008, ApJ, 672, 153 [NASA ADS] [CrossRef] [Google Scholar]
- Condon, J. J., Cotton, W. D., Greisen, E. W., et al. 1998, AJ, 115, 1693 [Google Scholar]
- Croton, D. J., Springel, V., White, S. D. M., et al. 2006, MNRAS, 365, 11 [Google Scholar]
- Dabhade, P., Röttgering, H. J. A., Bagchi, J., et al. 2020, A&A, 635, A5 [NASA ADS] [CrossRef] [EDP Sciences] [Google Scholar]
- Das, A., & Pandey, B. 2025, ArXiv e-prints [arXiv:2507.08790] [Google Scholar]
- Davé, R., Anglés-Alcázar, D., Narayanan, D., et al. 2019, MNRAS, 486, 2827 [Google Scholar]
- Davis, M., & Peebles, P. J. E. 1983, ApJ, 267, 465 [Google Scholar]
- Donley, J. L., Koekemoer, A. M., Brusa, M., et al. 2012, ApJ, 748, 142 [Google Scholar]
- Donoso, E. 2019, MNRAS, 487, 2824 [NASA ADS] [CrossRef] [Google Scholar]
- Donoso, E., Best, P. N., & Kauffmann, G. 2009, MNRAS, 392, 617 [Google Scholar]
- Donoso, E., Li, C., Kauffmann, G., Best, P. N., & Heckman, T. M. 2010, MNRAS, 407, 1078 [NASA ADS] [CrossRef] [Google Scholar]
- Dressler, A. 1980, ApJ, 236, 351 [Google Scholar]
- Evans, D. A., Worrall, D. M., Hardcastle, M. J., Kraft, R. P., & Birkinshaw, M. 2006, ApJ, 642, 96 [Google Scholar]
- Fabian, A. C. 2012, ARA&A, 50, 455 [Google Scholar]
- Guo, H., Zheng, Z., Zehavi, I., et al. 2014, MNRAS, 441, 2398 [NASA ADS] [CrossRef] [Google Scholar]
- Hale, C. L., Jarvis, M. J., Delvecchio, I., et al. 2018, MNRAS, 474, 4133 [NASA ADS] [CrossRef] [Google Scholar]
- Hansen, S. M., McKay, T. A., Wechsler, R. H., et al. 2005, ApJ, 633, 122 [Google Scholar]
- Hardcastle, M. J. 2004, A&A, 414, 927 [NASA ADS] [CrossRef] [EDP Sciences] [Google Scholar]
- Hardcastle, M. J., Evans, D. A., & Croston, J. H. 2006, MNRAS, 370, 1893 [Google Scholar]
- Hardcastle, M. J., Evans, D. A., & Croston, J. H. 2007, MNRAS, 376, 1849 [NASA ADS] [CrossRef] [Google Scholar]
- Heckman, T. M., Kauffmann, G., Brinchmann, J., et al. 2004, ApJ, 613, 109 [Google Scholar]
- Ineson, J., Croston, J. H., Hardcastle, M. J., et al. 2015, MNRAS, 453, 2682 [Google Scholar]
- Kauffmann, G., Heckman, T. M., Tremonti, C., et al. 2003, MNRAS, 346, 1055 [Google Scholar]
- Kewley, L. J., Dopita, M. A., Sutherland, R. S., Heisler, C. A., & Trevena, J. 2001, ApJ, 556, 121 [Google Scholar]
- Lacy, M., Storrie-Lombardi, L. J., Sajina, A., et al. 2004, ApJS, 154, 166 [Google Scholar]
- Li, C., Kauffmann, G., Jing, Y. P., et al. 2006, MNRAS, 368, 21 [NASA ADS] [CrossRef] [Google Scholar]
- Limber, D. N. 1953, ApJ, 117, 134 [NASA ADS] [CrossRef] [Google Scholar]
- Lin, Y.-T., Shen, Y., Strauss, M. A., Richards, G. T., & Lunnan, R. 2010, ApJ, 723, 1119 [Google Scholar]
- Malavasi, N., Bardelli, S., Ciliegi, P., et al. 2015, A&A, 576, A101 [NASA ADS] [CrossRef] [EDP Sciences] [Google Scholar]
- McNamara, B. R., & Nulsen, P. E. J. 2007, ARA&A, 45, 117 [NASA ADS] [CrossRef] [Google Scholar]
- McNamara, B. R., & Nulsen, P. E. J. 2012, New J. Phys., 14, 055023 [NASA ADS] [CrossRef] [Google Scholar]
- McNamara, B. R., Nulsen, P. E. J., Wise, M. W., et al. 2005, Nature, 433, 45 [NASA ADS] [CrossRef] [PubMed] [Google Scholar]
- Meneux, B., Guzzo, L., Garilli, B., et al. 2008, A&A, 478, 299 [NASA ADS] [CrossRef] [EDP Sciences] [Google Scholar]
- Mingo, B., Croston, J. H., Best, P. N., et al. 2022, MNRAS, 511, 3250 [NASA ADS] [CrossRef] [Google Scholar]
- Miraghaei, H., & Best, P. N. 2017, MNRAS, 466, 4346 [NASA ADS] [Google Scholar]
- Morganti, R. 2017, Front. Astron. Space Sci., 4, 42 [CrossRef] [Google Scholar]
- Norberg, P., Baugh, C. M., Hawkins, E., et al. 2002, MNRAS, 332, 827 [Google Scholar]
- Oei, M. S. S. L., van Weeren, R. J., Hardcastle, M. J., et al. 2022, A&A, 660, A2 [NASA ADS] [CrossRef] [EDP Sciences] [Google Scholar]
- Pace, C., & Salim, S. 2014, ApJ, 785, 66 [NASA ADS] [CrossRef] [Google Scholar]
- Pan, T., Fu, Y., Rottgering, H. J. A., et al. 2025, A&A, 695, A69 [NASA ADS] [CrossRef] [EDP Sciences] [Google Scholar]
- Peebles, P. J. E. 1980, The Large-Scale Structure of the Universe (Princeton: Princeton University Press) [Google Scholar]
- Puchwein, E., Sijacki, D., & Springel, V. 2008, ApJ, 687, L53 [NASA ADS] [CrossRef] [Google Scholar]
- Schlegel, D. J., Finkbeiner, D. P., & Davis, M. 1998, ApJ, 500, 525 [Google Scholar]
- Shabala, S. S., Kaviraj, S., & Silk, J. 2011, MNRAS, 413, 2815 [Google Scholar]
- Shakura, N. I., & Sunyaev, R. A. 1973, A&A, 24, 337 [NASA ADS] [Google Scholar]
- Shen, L., Tomczak, A. R., Lemaux, B. C., et al. 2019, MNRAS, 484, 2433 [Google Scholar]
- Skibba, R. A., Bamford, S. P., Nichol, R. C., et al. 2009, MNRAS, 399, 966 [NASA ADS] [CrossRef] [Google Scholar]
- Tasse, C., Best, P. N., Röttgering, H., & Le Borgne, D. 2008, A&A, 490, 893 [NASA ADS] [CrossRef] [EDP Sciences] [Google Scholar]
- Thomas, N., & Davé, R. 2022, MNRAS, 515, 5539 [NASA ADS] [CrossRef] [Google Scholar]
- Yang, X., Mo, H. J., Jing, Y. P., & van den Bosch, F. C. 2005, MNRAS, 358, 217 [Google Scholar]
- York, D. G., Adelman, J., Anderson, J. E., et al. 2000, AJ, 120, 1579 [Google Scholar]
- Zakamska, N. L., Strauss, M. A., Krolik, J. H., et al. 2003, AJ, 126, 2125 [NASA ADS] [CrossRef] [Google Scholar]
- Zehavi, I., Zheng, Z., Weinberg, D. H., et al. 2005, ApJ, 630, 1 [Google Scholar]
- Zehavi, I., Zheng, Z., Weinberg, D. H., et al. 2011, ApJ, 736, 59 [NASA ADS] [CrossRef] [Google Scholar]
The bias defined as (zphot − zspec)/(1 + zspec).
The Max Plank institute for Astrophysics/John Hopkins University (MPA/JHU) SDSS data base was produced by a collaboration of researchers (currently or formerly) from the MPA and the JHU. The team is made up of Stephane Charlot (IAP), Guinevere Kauffmann and Simon White (MPA), Tim Heckman (JHU), Christy Tremonti (U. Wisconsin-Madison – formerly JHU) and Jarle Brinchmann (Leiden University – formerly MPA). The data catalogues are available from https://wwwmpa.mpa-garching.mpg.de/SDSS/DR7/
Appendix A: Clustering of unclassified sources
Within our redshift interval, a non-negligible fraction of radio sources (∼30%) can not be securely classified into HERG or LERG on the basis of SDSS spectra alone, as it is reasonable to expect the SNR of line measurements to increase with redshift. Indeed, Best & Heckman (2012) find that many of these objects lie at high redshifts. Moreover, Figure 1 suggests that unclassified radio sources (green curves) could be made up of a mixture of populations, given the strong bimodality in many physical properties. This raises questions about the real nature of these populations and whether clustering estimates could shed light on it.
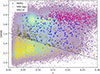 |
Fig. A.1. Redshift-D4000 two-dimensional histogram of SDSS galaxies (viridis coloured). We highlight our HERG sources (blue crosses), the UNCs of AGN type (UNC-agn, pink), and the UNCs of SF type (UNC-sf, yellow). Grey circles above the divide line mark UNC objects lying within the region occupied by known high- excitation radio galaxies. |
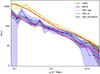 |
Fig. A.2. Projected cross-correlation function between SDSS galaxies and LERG (red), HERG (blue), UNCs of AGN type (UNC-agn, yellow), UNCs of SF type (UNC-sf, pink), and the subsample of UNC-sf objects with high D4000 values (UNC-sf-D4000, black) above the dividing line in Figure A.1. |
The cross-correlation estimate of UNC objects in our sample is shown in Figure 5. The distinction between the two halo terms is not very strong compared to LERG, and in general it looks broadly consistent with HERG. In Figure A.1 we plot the location of HERG AGNs (blue crosses) in the D4000 versus redshift plane. They spawn a range of values from the "early-type" galaxy cloud at D4000∼1.9, and extending into part of the ‘late-type’ cloud around D4000∼1.4. We then separate UNC objects into those classified as AGN (1047 sources, pink circles) or SF (1622 sources, yellow circles). The vast majority of UNC radio AGNs occupy an almost horizontal sequence that fairly matches the region populated by LERG. Star-forming radio galaxies with much younger stellar populations are predominantly found at low redshifts, but a fraction of those overlap with the zone populated by confirmed HERG. Therefore, we propose a cut in the D4000-z plane to isolate a subsample of these radio galaxies (245 sources, yellow circles with black border) that extend into the HERG zone and could have been potentially misclassified as SF with low SNR spectra. We chose the dividing boundary as D4000 ≥ -1.86 (z - 0.01) + 1.6 (black dashed curve) to maximize the overlap, but our analysis is not significantly altered by shifting the intercept by ± 0.1 or varying the slope by ± 20%.
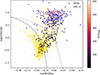 |
Fig. A.3. BPT diagram of HERG objects (blue crosses) and of UNCs selected as SF (UNC-sf, yellow). Circles coloured by O[III] SNR correspond to the subsample of UNC-sf that lie above the D4000 divide line in Figure A.1. For reference, we show the Kewley et al. (2001) maximum starburst line (dotted) and the Kauffmann et al. (2003) classification line (dashed). |
In Figure A.2 we compare the cross-correlation estimates of these various subsamples. On the one hand, it can be appreciated that UNC objects selected as AGN are strongly clustered, very much like LERG, and even slightly more. Considering that these objects are located mainly in the old, massive red part of the bimodal distributions of Figure 1, it is reasonably safe to consider them as potential LERG candidates. On the other hand, SF UNC objects show substantially lower clustering strengths across all scales, which is, again, not surprising given their location extending into the blue cloud of the colour-magnitude diagram. However, the cross-correlation function of "old" UNC objects selected above the dividing D4000-z line, is broadly consistent with the one of HERG. In Figure A.3 we can notice that a fraction of these sources lie well into the AGN/LINER region of the BPT diagram and populated by known HERG. This favors the idea that among these objects there could be HERG candidates, potentially misclassified as SF, and then perhaps lacking line measurements of enough quality to further separate into high or low excitation sources (though note that all four BPT lines are well detected). All three methods applied by Best & Heckman (2012) have their own weaknesses, and while the final (binary) classification attempts to minimize them, it inevitably inherits part of the uncertainties. Another possibility is simply that the dichotomy is not absolutely sharp, as in some cases the radio emission could be the result of both star formation and AGN activity.
All Tables
All Figures
|
Fig. 1. Main physical properties (redshift, r-band absolute magnitude, colour, D4000 index, stellar mass) of our spectroscopic SDSS galaxy sample (grey), LERGs (red), HERGs (blue), and unclassified radio sources (UNCs, green). The lower right panel shows their location in the colour-magnitude diagram. |
| In the text | |
|
Fig. 2. Distribution of radio luminosity of HERG (blue) and LERG (red) sources, as well as a control sample for the former built from low-excitation objects matched in various properties (CSHL, orange, see Section 2.4 for details). |
| In the text | |
|
Fig. 3. Same as Fig. 1, but for our LERGs (red) and its matched control sample of non-active galaxies (CSL, dark red). |
| In the text | |
|
Fig. 4. Same as Fig. 3, but for high-excitation radio galaxies (HERG, blue) and its matched control sample of non-active galaxies (CSH, light blue), as well as its control sample selected from LERG sources (CSHL, orange). |
| In the text | |
|
Fig. 5. Projected cross-correlation function between SDSS galaxies and LERGs (red), HERGs (blue), and radio sources without classification (green). For reference, we also show the autocorrelation of SDSS galaxies (grey). |
| In the text | |
|
Fig. 6. Projected cross-correlation function between SDSS galaxies and LERGs (red), its control of non-active galaxies (CSL, dark red), HERGs (blue), its control sample of non-active galaxies (CSH, dark blue), as well as the HERG control sample selected from LERG sources (CSHL, orange). |
| In the text | |
|
Fig. 7. Projected cross-correlation function of LERG (red), HERG (blue), LERG subsamples split in three bins of stellar mass (red symbols, see text), and HERG subsamples split in two bins of stellar mass (blue symbols). |
| In the text | |
|
Fig. 8. Top: Cross-correlation amplitude as function of stellar mass for our samples of LERGs, HERGs, and their corresponding control samples, restricted to the inner region (0.1 < rp < 1 h−1 Mpc). Bottom: Same as upper panel, but restricted to the outer region (1 < rp < 10 h−1 Mpc). |
| In the text | |
|
Fig. 9. Top: Cross-correlation amplitude as function of radio luminosity for our samples of LERGs, HERGs, and their corresponding control samples, restricted to the inner region (0.1 < rp < 1 h−1 Mpc). Bottom: Same as upper panel, but restricted to the outer region (1 < rp < 10 h−1 Mpc). We plot control curves at the same radio power of its corresponding radio active sample. |
| In the text | |
|
Fig. 10. Normalized u − r colour distributions for two scales (rp < 2 h−1 Mpc, left panel; rp < 1 h−1 Mpc, middle panel), corresponding to neighbours of LERG AGNs (N-LERGs, solid red), neighbours of HERG objects (N-HERG, dash-dotted blue), neighbours of the LERG control sample (N-CSL, dashed orange), and galaxies around HERG control sources (N-CSH, dotted purple). We smoothed the curves using a continuous probability density curve (KDE) with the smoothing bandwidth parameter set to 0.15. The right panel shows the mean colour as a function of rp. |
| In the text | |
|
Fig. 11. Normalized distributions of r-band absolute magnitude and its mean value as function of distance, for neighbour galaxies around AGNs and control objects (samples, colours, and styles as in Figure 10). |
| In the text | |
|
Fig. A.1. Redshift-D4000 two-dimensional histogram of SDSS galaxies (viridis coloured). We highlight our HERG sources (blue crosses), the UNCs of AGN type (UNC-agn, pink), and the UNCs of SF type (UNC-sf, yellow). Grey circles above the divide line mark UNC objects lying within the region occupied by known high- excitation radio galaxies. |
| In the text | |
|
Fig. A.2. Projected cross-correlation function between SDSS galaxies and LERG (red), HERG (blue), UNCs of AGN type (UNC-agn, yellow), UNCs of SF type (UNC-sf, pink), and the subsample of UNC-sf objects with high D4000 values (UNC-sf-D4000, black) above the dividing line in Figure A.1. |
| In the text | |
|
Fig. A.3. BPT diagram of HERG objects (blue crosses) and of UNCs selected as SF (UNC-sf, yellow). Circles coloured by O[III] SNR correspond to the subsample of UNC-sf that lie above the D4000 divide line in Figure A.1. For reference, we show the Kewley et al. (2001) maximum starburst line (dotted) and the Kauffmann et al. (2003) classification line (dashed). |
| In the text | |
Current usage metrics show cumulative count of Article Views (full-text article views including HTML views, PDF and ePub downloads, according to the available data) and Abstracts Views on Vision4Press platform.
Data correspond to usage on the plateform after 2015. The current usage metrics is available 48-96 hours after online publication and is updated daily on week days.
Initial download of the metrics may take a while.